Not all features contribute equally to customer satisfaction. Some features prevent dissatisfaction. Others create delight. Most product teams treat them the same way — and that is why backlogs are full of features nobody uses.
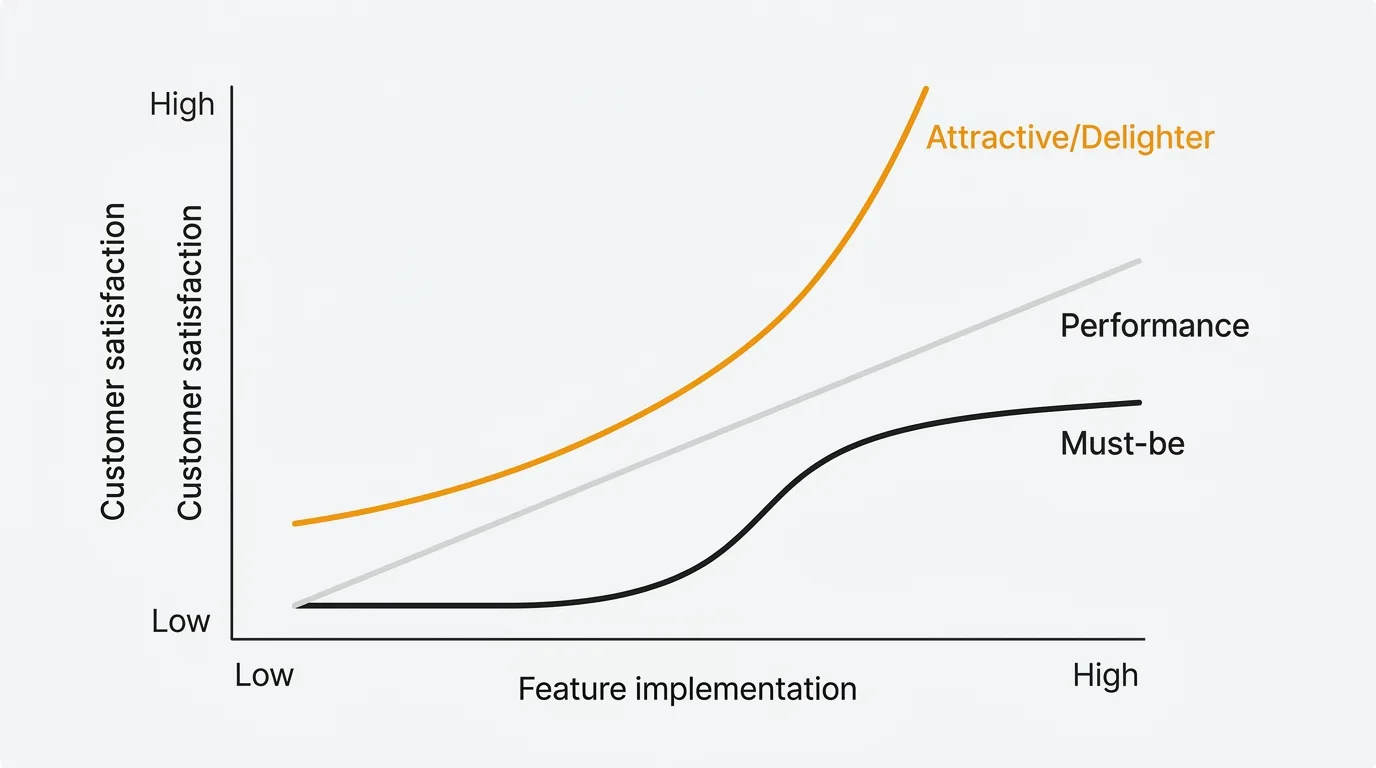
The Kano Model is a product prioritization framework that classifies features into five categories based on how they affect customer satisfaction: must-be, one-dimensional, attractive, indifferent, and reverse. It shows that satisfaction is not linear — some features only prevent dissatisfaction, while others create delight. You use it to separate must-haves from delighters before you commit engineering time.
Professor Noriaki Kano introduced this model in 1984 at Tokyo University of Science. The core insight: the relationship between feature implementation and customer satisfaction is not linear. A login system and an AI-powered recommendation engine both take engineering time, but they affect satisfaction in fundamentally different ways. The Kano Model gives you a framework to tell them apart before you build.
The five categories
Must-be (basic expectations)
Features customers take for granted. Their presence does not increase satisfaction, but their absence causes immediate dissatisfaction. You never get credit for these. You only get punished for missing them.
SaaS examples: Login and authentication, data export, uptime, password reset, basic search, email deliverability, GDPR compliance.
How to handle them: Invest enough to make them reliable. Do not invest beyond that — additional polish on a must-be feature produces diminishing returns. A beautifully designed login page does not make anyone more satisfied. A broken one makes everyone furious.
One-dimensional (performance)
Satisfaction scales linearly with how well the feature is implemented. More is better, less is worse. These are the features where investment produces proportional returns.
SaaS examples: Page load speed, storage limits, number of integrations, report customization depth, API rate limits, search relevance.
How to handle them: Benchmark against competitors. If your search is slower than theirs, that is a competitive disadvantage. If yours is faster, that is an advantage. Performance features are the main battleground for differentiation in mature markets.
Attractive (delighters)
Unexpected features that produce disproportionate satisfaction when present but cause zero dissatisfaction when absent. Customers did not expect them, so they cannot miss them. But when they discover them, the reaction is outsized.
SaaS examples: AI-powered summarization, smart auto-categorization, personalized onboarding flows, proactive anomaly alerts, natural language querying.
How to handle them: These create word-of-mouth and differentiation. They are your competitive moat — competitors cannot copy a delighter as easily as they can match a performance feature. But you cannot build a product on delighters alone. Must-be features come first.
Indifferent
Features customers do not care about either way. Presence or absence has no measurable effect on satisfaction. These are effort sinks.
SaaS examples: A settings page reorganization with no new functionality, backend framework changes with no user-facing impact, a changelog nobody reads, cosmetic updates to internal admin pages.
How to handle them: Stop building them. Every engineering hour spent on an indifferent feature is an hour not spent on a performance or attractive feature. Identifying indifferent features is one of the most valuable outcomes of Kano analysis — it tells you what to remove from the backlog.
Reverse
Features that actively decrease satisfaction when present. Some segment of users is annoyed by them.
SaaS examples: Forced onboarding tutorials that cannot be skipped, auto-playing video, aggressive notification defaults, gamification elements in a professional tool, mandatory two-factor authentication for low-risk actions.
How to handle them: Either remove them or make them optional. Reverse features often emerge when teams build for one persona without checking with others.
How to run a Kano survey
The Kano survey uses a specific question format: a functional/dysfunctional pair for each feature.
The question pair
For each feature, ask two questions:
Functional (positive): "If [feature] were available, how would you feel?"
Dysfunctional (negative): "If [feature] were NOT available, how would you feel?"
Both questions use the same five response options:
- I like it
- I expect it
- I am neutral
- I can tolerate it
- I dislike it
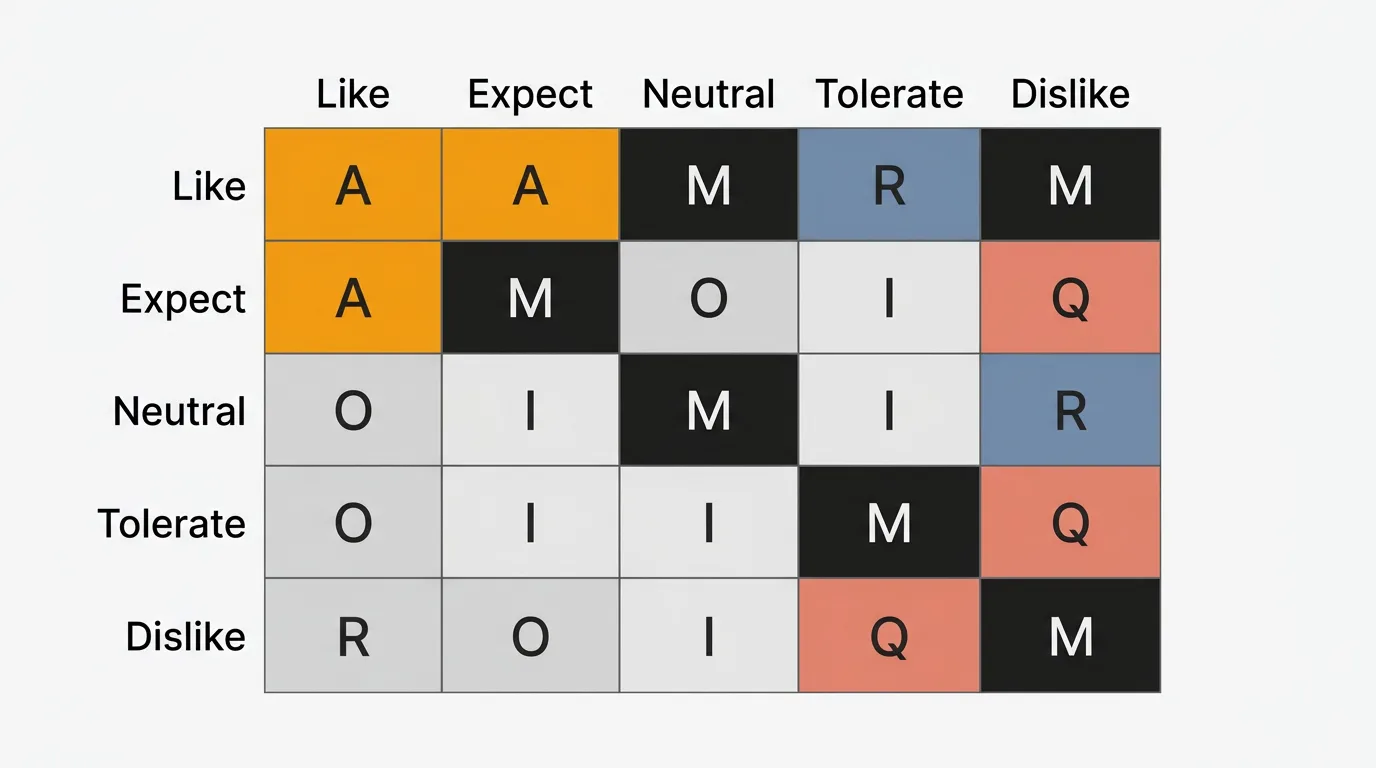
The evaluation table
Cross-reference the functional answer (row) with the dysfunctional answer (column) to classify the feature:
| Like | Expect | Neutral | Tolerate | Dislike | |
|---|---|---|---|---|---|
| Like | Q | A | A | A | O |
| Expect | R | I | I | I | M |
| Neutral | R | I | I | I | M |
| Tolerate | R | I | I | I | M |
| Dislike | R | R | R | R | Q |
M = Must-be, O = One-dimensional, A = Attractive, I = Indifferent, R = Reverse, Q = Questionable
How to read it: If a customer says "I like it" when the feature is present and "I dislike it" when absent, the intersection is O (Performance) — satisfaction and dissatisfaction both track with the feature. If they say "I like it" when present but "I am neutral" when absent, that is A (Attractive) — they enjoy it but do not miss it.
Practical tips
- Frame questions around feelings, not utility. "How would you feel if..." produces better classification than "Would you use..."
- Limit to 15-20 features per survey to avoid fatigue
- Segment results by persona or plan tier. A feature might be Must-be for enterprise users but Indifferent for self-serve users
- Minimum sample size: 20-30 respondents per segment for reliable classification
- Add an importance question: "How important is this feature to you?" on a 1-9 scale adds a weighting dimension that helps when categories are close
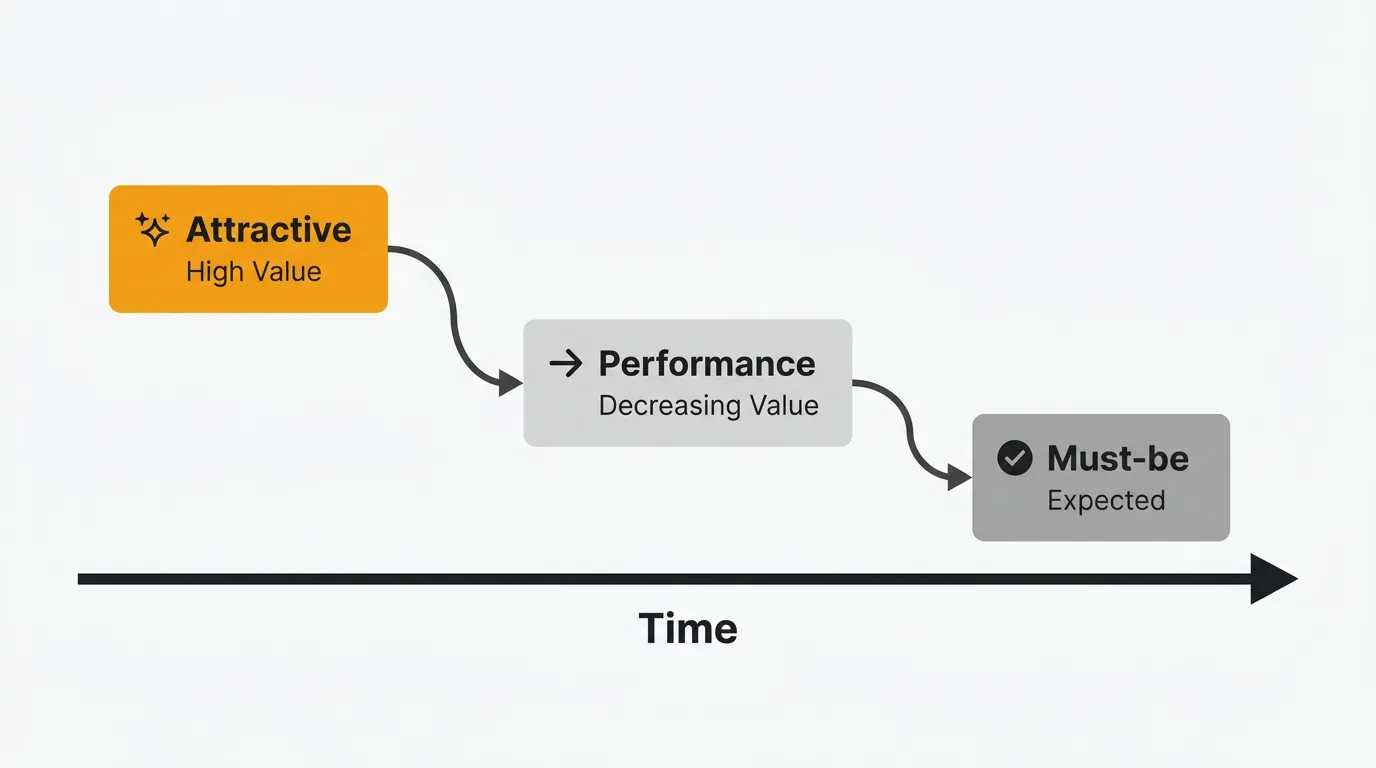
Feature decay: why today's delighter becomes tomorrow's expectation
This is the most important practical implication of the Kano Model. Features follow a predictable trajectory over time:
Attractive → Performance → Must-be
What delights today becomes expected tomorrow and table stakes next year.
| Feature | 2010 | 2018 | 2026 |
|---|---|---|---|
| Real-time collaboration | Attractive | Performance | Must-be |
| Mobile app for SaaS | Attractive | Performance | Must-be |
| Dark mode | — | Attractive | Performance |
| AI-powered features | — | — | Attractive |
Free hotel WiFi was once a delighter. Now its absence triggers one-star reviews. Smartphone touchscreens were magical in 2007. By 2015 they were table stakes. The same pattern plays out in SaaS on a faster timeline.
Implication: Re-run your Kano analysis every 12-18 months. In fast-moving SaaS markets, feature classifications shift quickly. You need a pipeline of new delighters because your current ones are decaying into expectations.
Using feedback data as a Kano proxy
A formal Kano survey is the gold standard, but you can approximate Kano categories using existing feedback data from your feedback board:
| Signal in feedback data | Likely Kano category |
|---|---|
| High vote count + frustration/churn mentions | Must-be (missing a basic expectation) |
| High vote count + positive anticipation | Performance (more = better) |
| Low request volume + outsized positive reaction when shipped | Attractive (unexpected delight) |
| Low vote count + flat engagement after launch | Indifferent (nobody cares) |
| Negative feedback after launching | Reverse (actively harmful) |
This is not as precise as a survey, but it lets you make Kano-informed decisions continuously using data you already collect. Quackback is built to run this loop continuously: a public board captures votes and frustration signals, AI-powered feedback analysis detects sentiment patterns across hundreds of submissions, and an MCP server lets you query your feedback directly from an AI assistant. Because Quackback is open source, you can give your whole team access to the data behind these classifications.
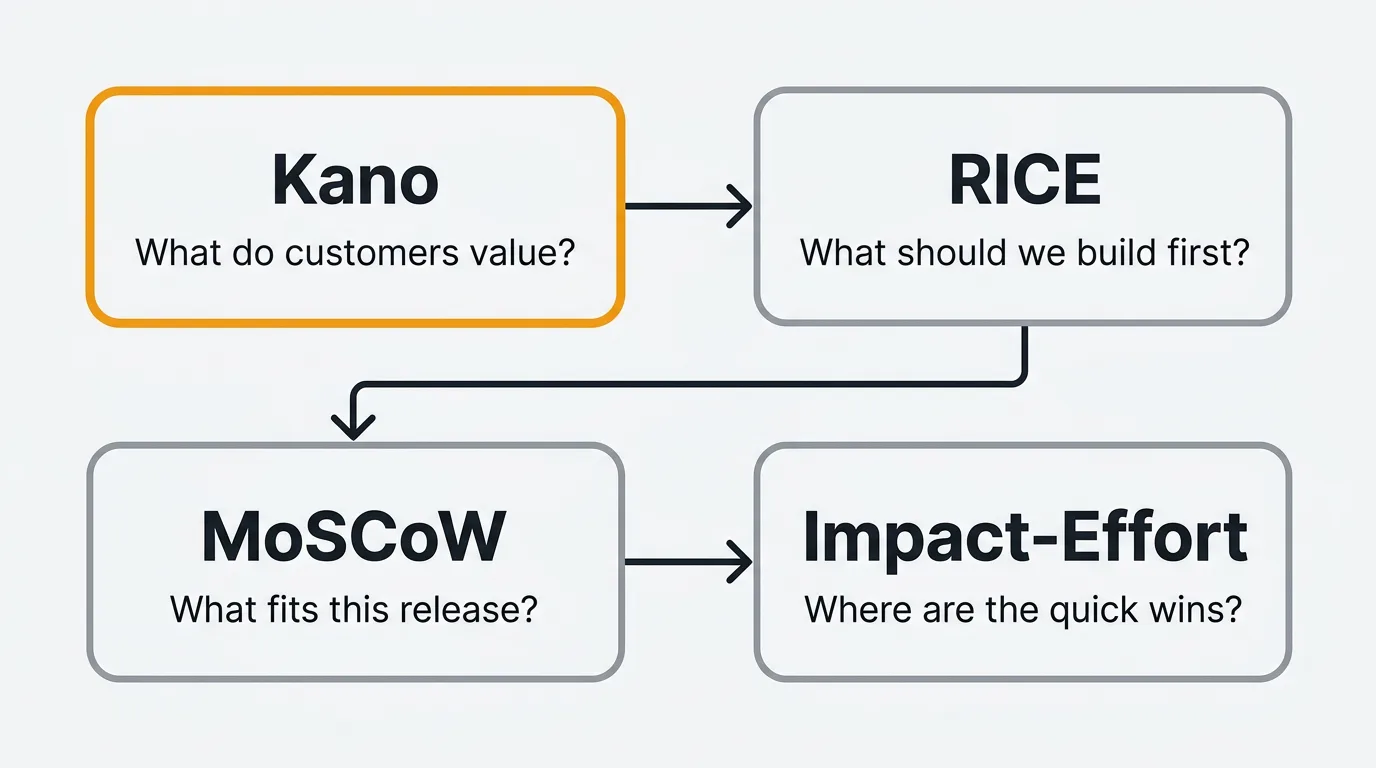
Kano vs other prioritization frameworks
The Kano Model answers a different question than RICE or MoSCoW. Here is when to use each:
| Framework | Question it answers | Best for |
|---|---|---|
| Kano | What do customers actually value? | Discovery — understanding emotional response before building |
| RICE | What should we build first? | Backlog ranking — scoring features by reach, impact, confidence, effort |
| MoSCoW | What fits in this release? | Sprint scoping — negotiating scope with stakeholders |
| Impact-Effort | Where are the quick wins? | Workshops — fast visual prioritization |
The recommended workflow: Use Kano during discovery to understand what matters. Feed Kano classifications into RICE scoring — a Must-be feature gets high Impact regardless of reach. Use MoSCoW to finalize what ships in the next sprint.
Try Quackback — open source with a managed cloud option. Start free. Get started | View on GitHub
Frequently asked questions
How many features should I test in a Kano survey?
Limit a Kano survey to 15-20 features. Each feature needs two questions (functional and dysfunctional), so 20 features means 40 questions, and beyond that respondent fatigue degrades data quality. Split larger feature lists across multiple surveys targeting different segments.
Can I use Kano for existing features or only new ones?
Both. For existing features, the Kano survey reveals whether customers view them as must-haves, performance differentiators, or indifferent. This is valuable for deciding where to invest improvement effort and where to stop. An existing feature classified as Indifferent is a candidate for deprecation.
How often should I re-run Kano analysis?
Every 12-18 months in fast-moving SaaS markets. Feature decay means today's delighter becomes next year's expectation. Annual re-evaluation catches these shifts before your competitive advantage erodes. Trigger an ad-hoc analysis after major market changes (new competitor, significant price shift, platform change).
What if results vary across customer segments?
Segment the analysis by persona or plan tier. A feature can be Must-be for enterprise customers (who expect SSO and compliance) but Indifferent for self-serve users. If you serve multiple segments, build must-be features for all and attractive features for your primary segment.
How does Kano analysis differ from just looking at feature votes?
Feature votes tell you how many people want something. Kano tells you how they will feel about it. A feature with 200 votes might be a Must-be (customers are frustrated it is missing) or an Attractive delighter (nice to have but fine without). That distinction changes the priority.
Authored by James Morton
Founder of Quackback. Building open-source feedback tools.
Try Quackback
The open-source feedback platform. Boards, voting, and roadmaps.
Get startedStar on GitHub132