Feature prioritization is one of the hardest parts of product management. Every team has more ideas than capacity. Users want different things. Stakeholders push competing agendas. Without a structured approach, decisions default to whoever argues loudest or whoever has the most seniority.
The result is predictable. You build features that don't move metrics. You delay high-impact work because it wasn't top of mind during planning. You can't explain to your team or your users why you chose one thing over another.
RICE gives you a framework to score and compare ideas objectively. It won't make decisions for you, but it surfaces trade-offs clearly, replaces gut feelings with structured reasoning, and gives your team a shared language for prioritization.
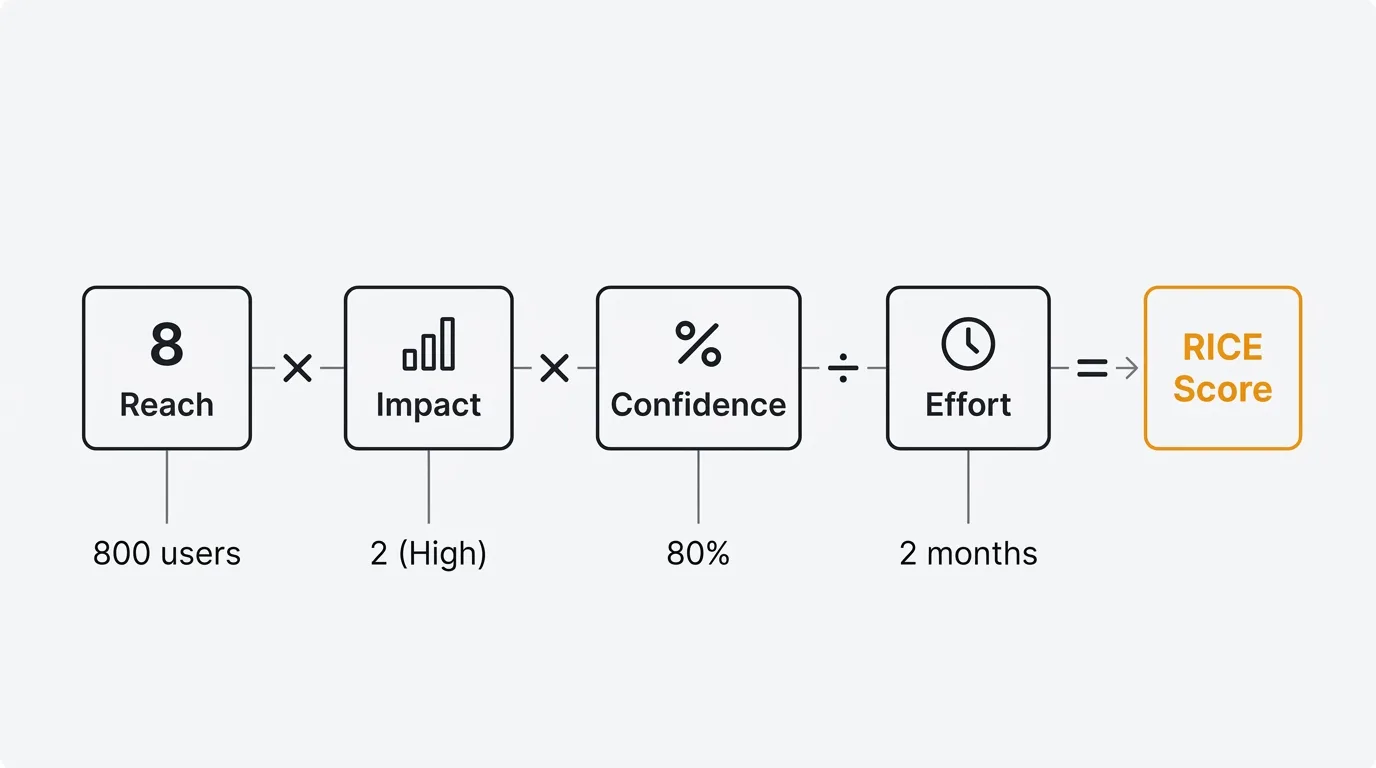
RICE is a product prioritization framework that scores each feature on four factors — Reach, Impact, Confidence, and Effort — using the formula
(Reach x Impact x Confidence) / Effort. The higher the score, the better the value per unit of work, so you rank your backlog by score to decide what to build first. It turns subjective debate into a defensible, comparable number.
What is the RICE framework?
RICE is a prioritization framework developed by Intercom's product team in 2016. It scores ideas across four factors — Reach, Impact, Confidence, and Effort — and produces a numeric score you use to rank your backlog.
The formula is straightforward:
RICE Score = (Reach x Impact x Confidence) / Effort
The numerator captures the total expected value of an idea. Reach tells you how many users benefit. Impact tells you how much they benefit. Confidence adjusts for uncertainty. Dividing by Effort gives you a value-per-unit-of-work score that makes it possible to compare a small quick win against a large strategic bet.
RICE works because it forces you to think about each dimension separately. Most teams already consider reach and effort intuitively. But they rarely estimate confidence explicitly, so a well-researched idea scores the same as a speculative one. And they rarely quantify impact on a consistent scale, making comparison across feature types impossible.
The framework is simple enough to use in a spreadsheet. Score each idea, sort by RICE score, and you have a defensible starting point for your roadmap.
The four RICE factors
Reach
Reach measures how many users will be affected by this feature in a given time period. The standard unit is users per quarter, but you can adapt it to whatever makes sense for your product: monthly active users, transactions per month, or new signups per quarter.
The key is consistency. Every idea on your list should use the same Reach metric and the same time period. If you measure one feature's reach in daily active users and another in annual signups, the comparison is meaningless.
Where do you get reach numbers? Your analytics. If you're building a feature for your settings page, check how many users visit that page per quarter. If you're improving onboarding, use your quarterly new signup count. If you're adding an integration, check your feedback board for request counts and support ticket volumes. Even a rough estimate based on real data is better than guessing.
Examples:
- A change to the onboarding flow that affects every new user: 2,000 users/quarter (based on your signup rate).
- A new integration requested by a segment of your user base: 400 users/quarter (based on voting data and usage patterns).
- A power-user feature for a niche workflow: 50 users/quarter.
Impact
Impact measures how much this feature will move the needle for each user it reaches. Unlike Reach, which is a concrete number, Impact uses a standardized scale:
- 3 = Massive impact. A fundamental improvement to the user experience or a feature that directly drives conversion, retention, or revenue.
- 2 = High impact. A significant improvement that users will notice and value.
- 1 = Medium impact. A useful improvement, but not life-changing.
- 0.5 = Low impact. A minor improvement. Nice to have.
- 0.25 = Minimal impact. Barely noticeable to most users.
The scale is intentionally coarse. Trying to distinguish between 1.7 and 1.8 is false precision. The five-point scale forces a judgment call: is this a big deal or a small deal?
Impact is the most subjective RICE factor. Two people on your team might score the same feature differently. That's fine — the conversation about why they disagree is often more valuable than the score itself.
To calibrate, pick shipped features as reference points. "CSV export was a 1. The dashboard redesign was a 2." Shared references reduce subjective drift over time.
Confidence
Confidence is a percentage that reflects how sure you are about your Reach and Impact estimates. It adjusts the score downward when you're guessing and keeps it high when you have evidence.
Use these benchmarks:
- 100% = High confidence. You have quantitative data: usage analytics, A/B test results, or large sample survey data.
- 80% = Medium confidence. You have some supporting data but not conclusive evidence. Qualitative feedback from interviews, or directional data from a small sample.
- 50% = Low confidence. Mostly a gut feeling. You think it's a good idea, but you don't have data to back it up.
Below 50%, you probably shouldn't be scoring the idea at all. You should be running a discovery sprint to learn more.
Confidence is what makes RICE more honest than other frameworks. Without it, a speculative moonshot scores the same as a well-validated improvement. With it, the speculative idea gets discounted appropriately.
How do you increase confidence? Gather data. Check your feature voting board for request volume and user comments. Interview users who asked for the feature. Analyze support tickets. Build a prototype and test it. Every piece of evidence moves your Confidence score up.
When 200 users have voted for a feature and left detailed comments, your Confidence in Reach and Impact is much higher than when two users mentioned it in passing during sales calls.
Effort
Effort measures how much work this feature requires, expressed in person-months. One team member working for one month is 1 person-month. A feature that takes one engineer two weeks is 0.5 person-months. Two engineers, one designer, and one PM working a full month is 4 person-months.
Include all work: design, engineering, QA, documentation, and launch activities. Teams that only count engineering time consistently underestimate Effort.
Keep the unit consistent across all features. And be honest — the natural tendency is to underestimate, especially for features you're excited about.
Examples:
- Adding a new notification preference toggle: 0.5 person-months.
- Building a new integration with a third-party API: 2 person-months.
- Redesigning the reporting dashboard: 6 person-months.
RICE scoring example
Let's walk through three feature ideas for a SaaS product and score each one.
Feature A: Slack integration for notifications
Users have been asking for Slack notifications when key events happen. You have data from your feedback board showing demand.
- Reach: 800 users/quarter. Based on voting data and the percentage of your user base that uses Slack.
- Impact: 2 (High). Keeps users engaged without requiring them to check your product constantly.
- Confidence: 80%. You have voting data and interview feedback, but you haven't validated the exact notification types users want.
- Effort: 2 person-months. One engineer for backend integration, plus design and QA time.
RICE Score = (800 x 2 x 0.8) / 2 = 640
Feature B: Advanced analytics dashboard
A redesigned analytics page with custom date ranges, new chart types, and exportable reports.
- Reach: 1,200 users/quarter. Most active users visit the analytics page.
- Impact: 1 (Medium). Useful but not transformative. Users can already see their data; this makes it easier to slice.
- Confidence: 50%. You've heard requests for better analytics, but you haven't validated which specific improvements matter most.
- Effort: 4 person-months. Two engineers for two months, plus design.
RICE Score = (1,200 x 1 x 0.5) / 4 = 150
Feature C: Onboarding checklist
A guided checklist that walks new users through setup steps during their first week.
- Reach: 500 users/quarter. Based on your new signup rate.
- Impact: 3 (Massive). Your data shows that users who complete setup in the first week retain at 3x the rate of those who don't.
- Confidence: 100%. You have strong retention data and A/B test results from a similar feature at a previous company.
- Effort: 1.5 person-months. One engineer, one designer, three weeks.
RICE Score = (500 x 3 x 1.0) / 1.5 = 1,000
The ranking
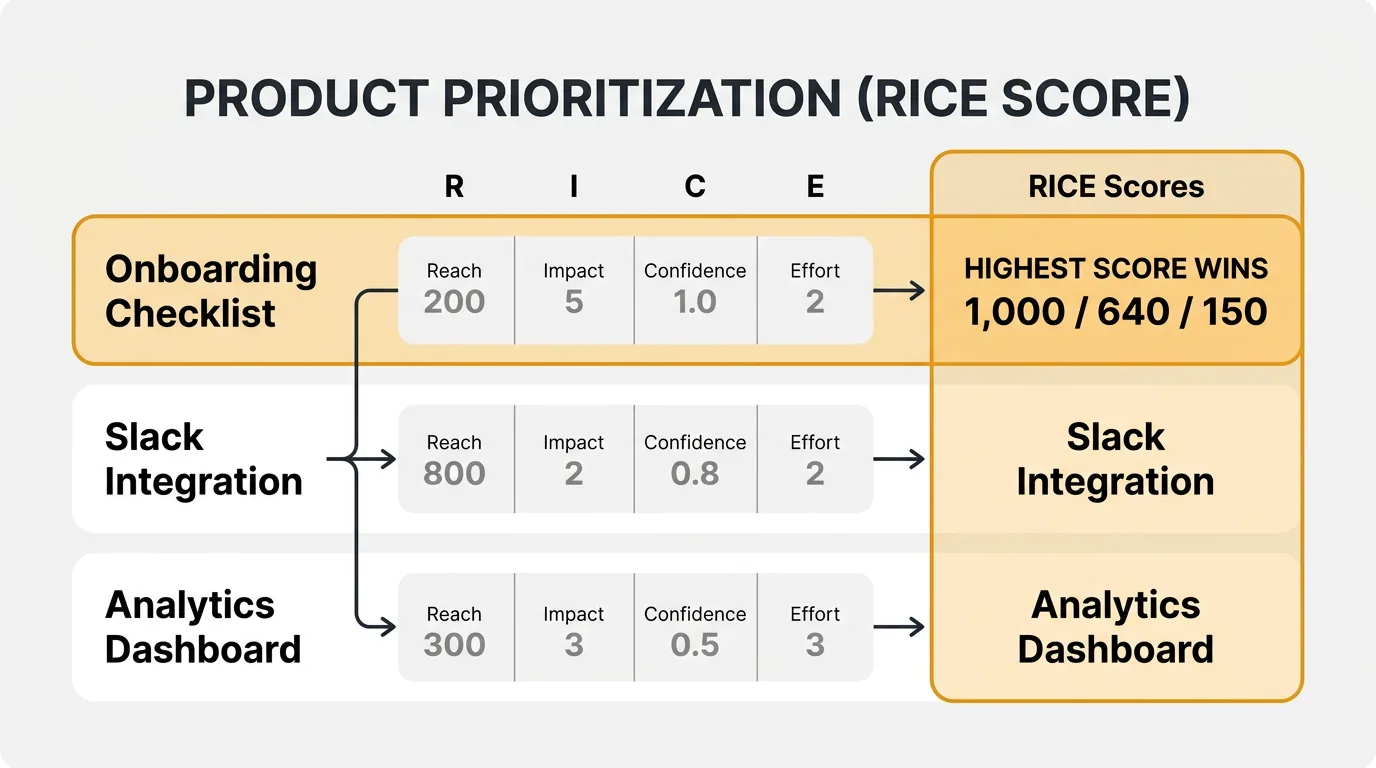
| Feature | Reach | Impact | Confidence | Effort | RICE Score |
|---|---|---|---|---|---|
| C: Onboarding checklist | 500 | 3 | 100% | 1.5 | 1,000 |
| A: Slack integration | 800 | 2 | 80% | 2 | 640 |
| B: Advanced analytics | 1,200 | 1 | 50% | 4 | 150 |
The onboarding checklist wins despite having the lowest Reach. Its massive Impact, high Confidence, and low Effort make it the best investment. The advanced analytics dashboard scores last — not because it's a bad idea, but because low Confidence and high Effort make it a risky bet. The right move might be to run a discovery sprint on analytics (increasing Confidence) before committing 4 person-months to it.
The scores don't make the decision. They start the conversation in the right place.
RICE vs other prioritization frameworks
RICE is not the only prioritization framework. Here's how it compares to the alternatives.
ICE (Impact, Confidence, Ease)
ICE scores three factors on a 1-10 scale and multiplies them together. Simpler than RICE — it drops Reach and replaces Effort with Ease (the inverse).
Pros: Fast to score. Low overhead. Good for early-stage teams with small backlogs. Cons: No Reach component means a feature affecting 10 users scores the same as one affecting 10,000. The 1-10 scale for each factor introduces more subjectivity than RICE's structured scales.
MoSCoW (Must, Should, Could, Won't)
MoSCoW sorts features into four buckets rather than scoring them numerically. Must-haves are non-negotiable. Should-haves are important but not critical. Could-haves are nice to have. Won't-haves are explicitly out of scope.
Pros: Simple to explain. Forces a "won't do" category, which many frameworks lack. Cons: No way to prioritize within a bucket. If you have 15 must-haves, you still need a second framework to rank them. Everything tends to drift into the "must" bucket over time.
WSJF (Weighted Shortest Job First)
WSJF comes from the SAFe (Scaled Agile Framework) methodology. It divides cost of delay by job duration. Cost of delay includes user value, time criticality, and risk reduction.
Pros: Accounts for time sensitivity, which RICE does not. Good for features with deadlines or market windows. Cons: More complex to score. Cost of delay is harder to estimate than RICE's four factors. Best suited for organizations already using SAFe.
Kano model
The Kano model categorizes features by their effect on satisfaction: basic expectations (cause dissatisfaction when missing), performance features (satisfaction scales linearly), and delighters (unexpected features that create outsized satisfaction).
Pros: Captures the non-linear relationship between features and satisfaction. Prevents over-investing in basics. Cons: Requires user research to categorize accurately. Doesn't produce a numeric ranking, so you still need a scoring method for build order.
RICE is a good default for most product teams. It balances simplicity with rigor. If you need to account for time sensitivity, consider WSJF. For speed over precision, use ICE. Use MoSCoW for stakeholder communication, and the Kano model for strategic thinking — but pair either with a numeric scoring method for tactical prioritization.
Tips for using RICE effectively
1. Score as a team, not alone. RICE works best when multiple people contribute estimates. The PM might know Reach best. Engineering knows Effort best. Designers often have a different read on Impact. Score together, discuss disagreements, and converge on a number. The conversation matters as much as the score.
2. Revisit scores when new data arrives. RICE scores are snapshots. When you collect new customer feedback or ship a feature that changes the landscape, update affected scores. A feature you scored at 50% Confidence six months ago might be at 80% now that you have voting data from your feedback board.
3. Don't over-optimize the formula. RICE is a decision-support tool, not a decision-making algorithm. If two features score 620 and 640, they are effectively tied. The framework is most valuable when it separates the 1,000s from the 150s — revealing that an idea you assumed was important is a poor investment compared to alternatives.
4. Use consistent time periods and units. Measure Reach in the same time period for every feature. Measure Effort in the same unit. If you mix quarterly reach with annual reach, or person-weeks with person-months, the scores are not comparable.
5. Keep a scoring log. Document the reasoning behind each score, not just the number. "Reach = 800 based on Slack usage survey from Q4" is far more useful than "Reach = 800" when you revisit three months later. The log also helps onboard new team members into your prioritization process.
Tools for RICE scoring
You can run RICE scoring in a spreadsheet. Create columns for Reach, Impact, Confidence, Effort, and the calculated RICE score. Sort by score. That works fine for small backlogs.
For a faster option, use Quackback's RICE calculator. Enter your four values and get the score instantly, which is useful during planning meetings or when evaluating a single idea.
The harder part of RICE is not the math — it's getting reliable inputs. This is where feature voting data becomes valuable. When users vote on features and leave comments on your feedback board, you get real data for two of the four RICE factors. Vote counts inform Reach. The volume and specificity of comments inform Confidence. Instead of guessing how many users want a feature, you see the number directly.
Quackback is open source and self-hosted, with a managed Quackback Cloud option. Your whole team can score and discuss the backlog together. Its MCP server also lets an AI assistant read your live vote counts and feedback, so you can draft RICE estimates straight from real demand data rather than memory.
The framework provides the structure. Feedback data provides the inputs. Together, they replace opinion-driven prioritization with something defensible.
If you're building out your product management toolkit, RICE scoring and a feature request tool are two of the highest-leverage additions you can make.
Try Quackback — open source with a managed cloud option. Start free. Get started | View on GitHub
Frequently asked questions
When should you not use RICE?
Avoid RICE for infrastructure work, technical debt, or compliance requirements, where Reach and Impact do not map cleanly. Use a separate track for those. Bug fixes and security patches have their own urgency criteria and do not belong in a RICE scoring exercise. RICE suits user-facing features best.
How often should you re-score your backlog?
Re-score at the start of each planning cycle — typically quarterly. Between cycles, update individual scores when significant new data arrives: a spike in feature requests, user research results, or a change in team capacity that affects Effort estimates. Avoid re-scoring everything weekly. The overhead erodes the framework's value.
Can you customize the RICE scales?
Yes. The standard scales are a starting point. Some teams add a sixth Impact level, use a 1-10 Confidence scale, or measure Effort in story points. What matters is that your team agrees on the definitions and uses them consistently. Customizing scales is fine; changing them mid-cycle is not.
How do you handle dependencies between features?
RICE scores each feature independently, so it doesn't account for dependencies. If Feature B requires Feature A, the score alone won't tell you that. Handle dependencies separately — flag them during scoring, and when you build your roadmap, sequence dependent features together regardless of individual scores.
Authored by James Morton
Founder of Quackback. Building open-source feedback tools.
Try Quackback
The open-source feedback platform. Boards, voting, and roadmaps.
Get startedStar on GitHub132