If your team cannot name your North Star Metric in one sentence, you do not have one. And if you do not have one, every team is optimizing for something different.
A North Star Metric (NSM) is the single metric that best captures the core value your product delivers to customers. To find yours, identify the moment a customer receives value, pick one measurable proxy for it that leads revenue, then surround it with three to five input metrics each team can own. Validate the metric against historical data and revisit it quarterly.
The North Star Metric (NSM) is the single metric that best captures the core value your product delivers to customers. Sean Ellis — the Silicon Valley entrepreneur who coined "growth hacking" after driving breakout growth at Dropbox, LogMeIn, and Eventbrite — developed the concept in the early 2010s. Amplitude later formalized it into the North Star Framework, adding structure around input metrics and team alignment.
The purpose is simple: give every team a shared definition of success so that engineering, marketing, sales, and support are all pulling in the same direction.
What makes a valid North Star Metric
A good NSM must pass three tests:
1. It reflects customer value, not company value. The NSM measures the value you deliver, not the revenue you extract. "Monthly recurring revenue" fails this test — MRR can increase through price hikes that harm customers. "Nights booked" (Airbnb) passes because every night booked represents real value for both guests and hosts.
2. It correlates with revenue as a leading indicator. The NSM is not a revenue metric, but it must predict revenue. When your NSM rises and holds, revenue should follow over the months that come after. If it does not, you are measuring the wrong thing. Validate this against your own historical data over a long enough window to see the lag — typically several months to a year.
3. It is measurable and actionable across teams. Every team should be able to see how their work connects to the NSM. Engineering ships features that drive it. Marketing acquires users who contribute to it. Support reduces friction that suppresses it. If the metric is too abstract for a team to act on, it is not actionable enough.

Real company examples
| Company | North Star Metric | Why it works |
|---|---|---|
| Spotify | Time spent listening | Measures the value users receive; more listening correlates with subscription retention |
| Airbnb | Nights booked | Captures value for both sides of the marketplace |
| Slack | Daily messages sent | Signals Slack is the default communication tool; deeper usage correlates with team lock-in |
| Netflix | Hours of content watched per week | Engagement depth, not just logins — predicts retention |
| Uber | Number of trips | Unites rider and driver sides of the marketplace |
| HubSpot | Weekly active teams | Multi-user adoption correlates with retention and expansion |
| Shopify | Active merchants | Each active merchant represents ongoing GMV and platform stickiness |
Patterns by business type:
- Marketplaces (Airbnb, Uber): Transaction volume
- Media and content (Spotify, Netflix): Consumption metrics
- Collaboration SaaS (Slack, HubSpot): Team-level engagement
- E-commerce platforms (Shopify): Active entity counts
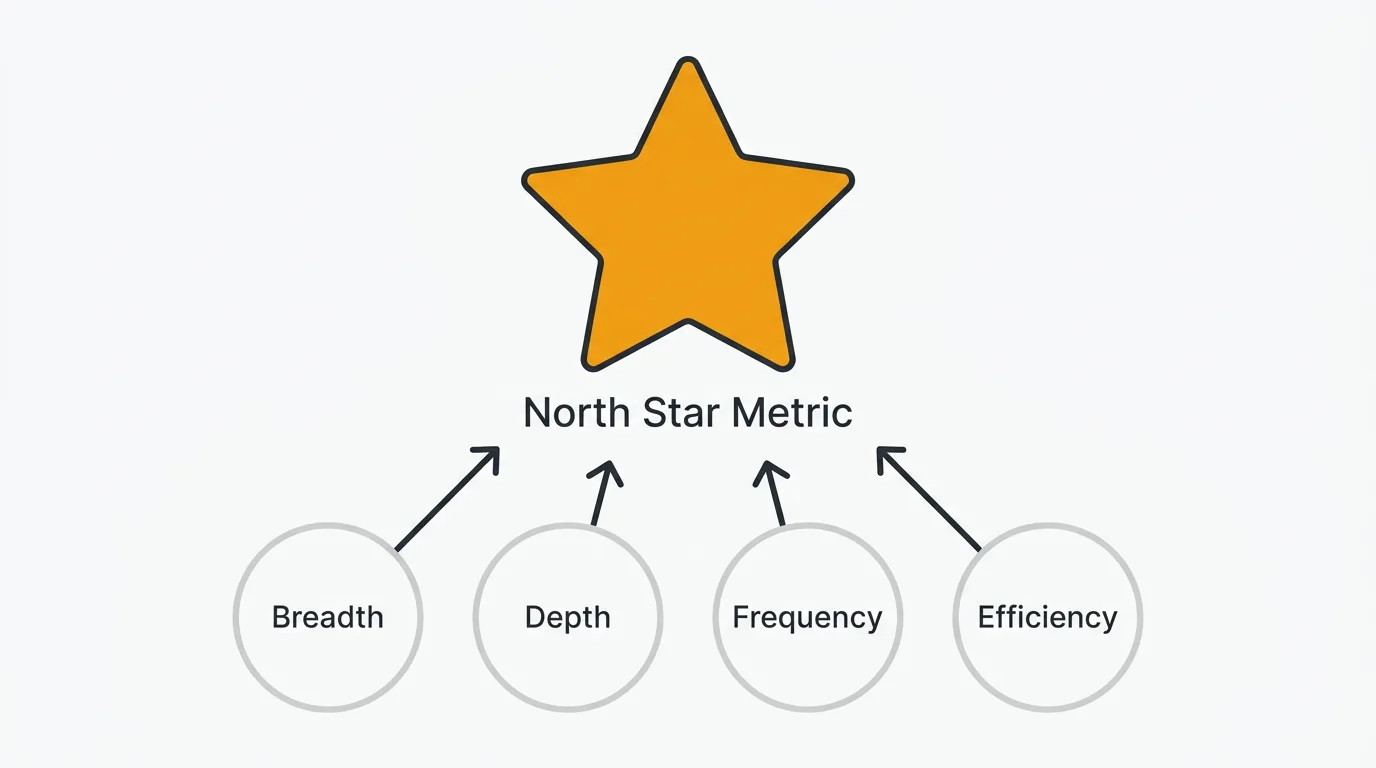
The constellation model: NSM + input metrics
The NSM alone is not enough. You cannot directly move a North Star Metric — it is the result of many factors. What you can move are input metrics: three to five actionable measures that feed into the NSM.
Amplitude's framework uses four dimensions to identify input metrics:
| Dimension | What it measures | Example (Spotify) |
|---|---|---|
| Breadth | How many users take the key action | Number of active listeners |
| Depth | Extent of their engagement | Hours per listening session |
| Frequency | How often they engage | Sessions per week |
| Efficiency | How quickly they reach value | Time from signup to first playlist |
Why input metrics matter: "If you can move your North Star directly, it is probably not a good North Star." The NSM should be one level removed from direct action, forcing teams to think about the levers that drive it. Input metrics are those levers.
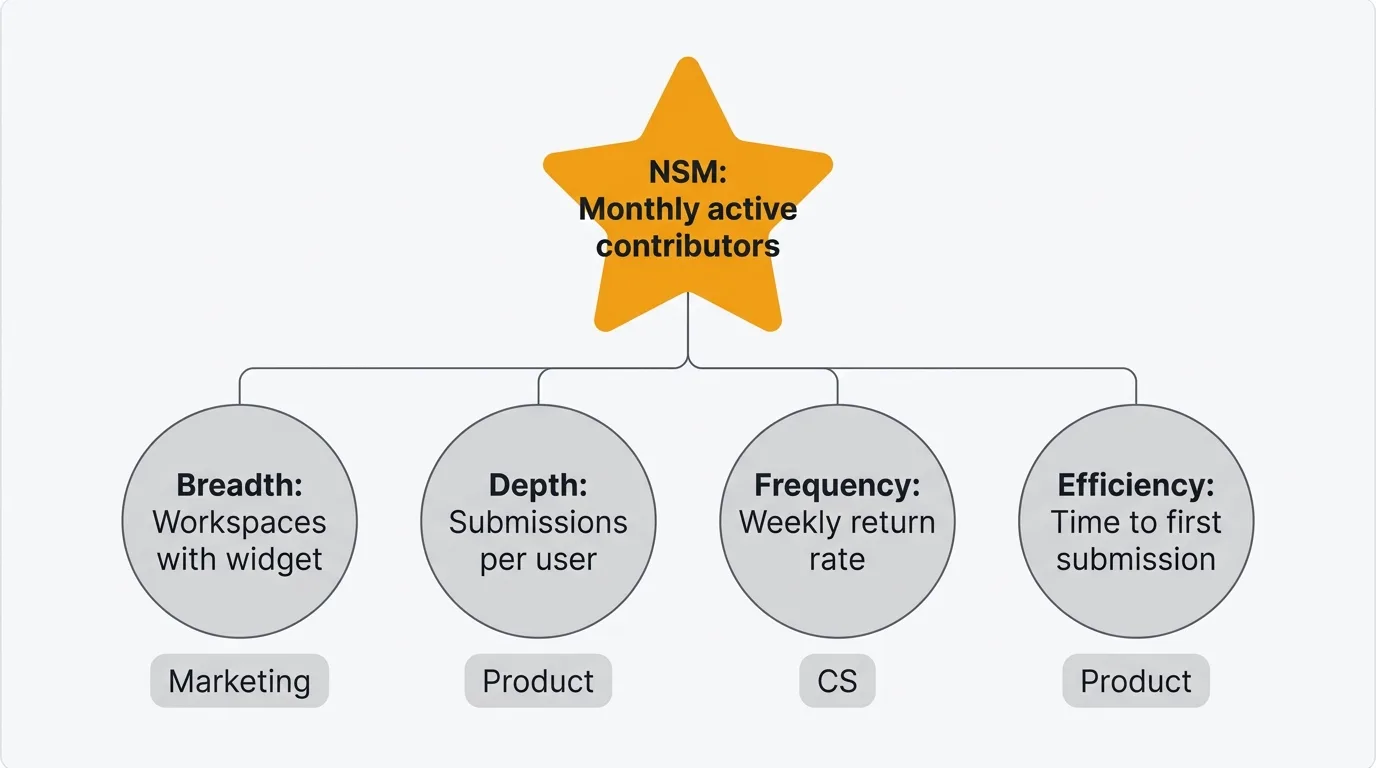
Example constellation for a feedback tool. This is the constellation we use to think about Quackback itself:
- NSM: Monthly active feedback contributors (users who submit, vote, or comment)
- Breadth input: Number of workspaces with the feedback widget installed
- Depth input: Average feedback submissions per active user
- Frequency input: Weekly return rate of contributors
- Efficiency input: Time from widget installation to first feedback submission
Each input metric can be owned by a team. Marketing drives breadth. Product drives depth and efficiency. Customer success drives frequency. A public roadmap closes the loop — contributors who see their input shape what ships come back, which lifts the frequency input.
How to find your North Star Metric
Step 1: Start with customer value
Ask: "When does our customer receive the value they are paying for?" Not "When do we make money?" but "When does the customer's problem get solved?"
Talk to customers. Read feedback submissions. Analyze support conversations. The answer often emerges from how customers describe success in their own words.
Step 2: Brainstorm candidates
Generate three to five candidate metrics based on what you learned. For a project management tool, candidates might be: tasks completed, active projects, team collaboration events, or weekly active users.
Step 3: Evaluate against the three criteria
For each candidate:
- Does it increase only when customers receive more value?
- Does it correlate with revenue as a leading indicator? (Check historical data)
- Can every team connect their work to moving this number?
Step 4: Pick one
The whole point is singular focus. If you have three North Stars, you have none. Pick the candidate that best balances all three criteria.
Step 5: Define input metrics
Use the breadth/depth/frequency/efficiency framework to identify three to five input metrics. Assign ownership of each to a specific team.
Step 6: Revisit quarterly
Your NSM should be stable, but not permanent. As your product and market evolve, the metric that best captures customer value may shift. Review quarterly and change if the correlation with revenue weakens.
Common mistakes
Choosing a vanity metric
Downloads, page views, and registered users look impressive in board meetings but do not reflect value delivery. A million downloads means nothing if nobody opens the app twice. Your NSM should measure ongoing value, not one-time events.
Using revenue as your NSM
Revenue is the result of delivering value, not the measure of it. MRR, ARPU, and ARR are critical business metrics, but they are lagging indicators — by the time they move, the cause is months old. Your NSM should be a leading indicator that predicts revenue, not revenue itself.
Picking multiple North Stars
Some frameworks argue for separate NSMs for acquisition, retention, and monetization. These are useful as complementary tracking, but they are not North Stars. The NSM is one number that the entire company rallies around. Multiple "North Stars" dilute focus and recreate the alignment problem the framework is supposed to solve.
No decomposition into input metrics
"We are tracking monthly active users" without defining what drives MAU is a statement, not a strategy. Without input metrics, teams have no line of sight from their daily work to the outcome that matters. The constellation model — NSM plus input metrics with clear ownership — is what makes the framework actionable.
Gaming the metric
Sending push notifications to inflate "daily active users" or discounting to pump "orders completed" may move the number temporarily but erodes trust and retention. If your NSM can be gamed without delivering more customer value, it is the wrong metric.
Never evolving the metric
As your product and market change, so should your NSM. Mixpanel draws an analogy: when the Egyptians built the pyramids, Earth had a different North Star — Thuban. It has since drifted out of alignment, just as a metric can. Review your NSM quarterly and change it if it no longer reflects the core value your product delivers.
How feedback connects to your NSM
Product feedback plays three roles in the North Star framework:
Finding your NSM. If you struggle to articulate your NSM, customer interviews and feedback submissions are the starting point. Ask customers what success looks like. Their answers point toward the value your metric should capture.
Diagnosing movement. When your NSM dips, quantitative data tells you what changed. Feedback tells you why. A spike in negative feedback about onboarding explains a drop in the efficiency input metric. Without the qualitative signal, you are guessing at root causes. Quackback exposes your feedback through an MCP server, so you can ask an AI assistant to summarize what changed and surface themes behind a metric move.
Preventing gaming. Qualitative feedback acts as a check on metric gaming. If your NSM is rising but customer sentiment is declining, something is wrong. The disconnect between the metric and the feeling is a red flag that the metric is no longer capturing real value.
Try Quackback — open source with a managed cloud option. Collect feedback, run voting, and ship a public roadmap so the input metrics behind your North Star stay grounded in real customer value. Get started | View on GitHub
Frequently asked questions
How is a North Star Metric different from a KPI?
KPIs are departmental performance measures — marketing tracks lead volume, sales tracks conversion rate, support tracks resolution time. The NSM is a company-wide measure of customer value that all departments contribute to. KPIs feed into the NSM; the NSM provides the shared context that connects them.
Can a small startup use the North Star framework?
Yes, and it is arguably more valuable for small teams. When you have five people, alignment is easy — everyone talks to each other. When you grow to twenty, then fifty, the NSM keeps teams aligned without requiring constant coordination. Start with the NSM early and evolve it as you learn more about your customers.
How do I know if my NSM is working?
Two signals: First, does the NSM correlate with revenue over a twelve-month lookback? If it rises and revenue follows (with a lag), the metric captures real value. Second, can every team explain how their current work affects the NSM? If teams are confused about the connection, the metric is either wrong or under-communicated.
What if my product serves multiple customer segments?
Pick the NSM that captures value for your primary segment. If you serve both enterprise and self-serve customers, the NSM should reflect the value delivered to both — which usually means focusing on product engagement rather than revenue (since revenue metrics weight enterprise disproportionately). Segment-specific metrics belong in your input metric constellation, not as competing North Stars.
How often should I change my North Star Metric?
Rarely. A good NSM is stable for one to three years. Change it when: the correlation with revenue breaks down, your product strategy fundamentally shifts (new market, new positioning), or you discover a better proxy for customer value through feedback analysis and data review. Quarterly reviews should confirm the metric, not change it by default.
Authored by James Morton
Founder of Quackback. Building open-source feedback tools.
Try Quackback
The open-source feedback platform. Boards, voting, and roadmaps.
Get startedStar on GitHub132