There are two types of feedback. Most product teams collect one well and neglect the other. The result is either a spreadsheet of numbers with no context, or a pile of comments with no way to gauge scale.
Both types matter. Knowing when to use each — and how to combine them — is one of the more practical skills in product management.

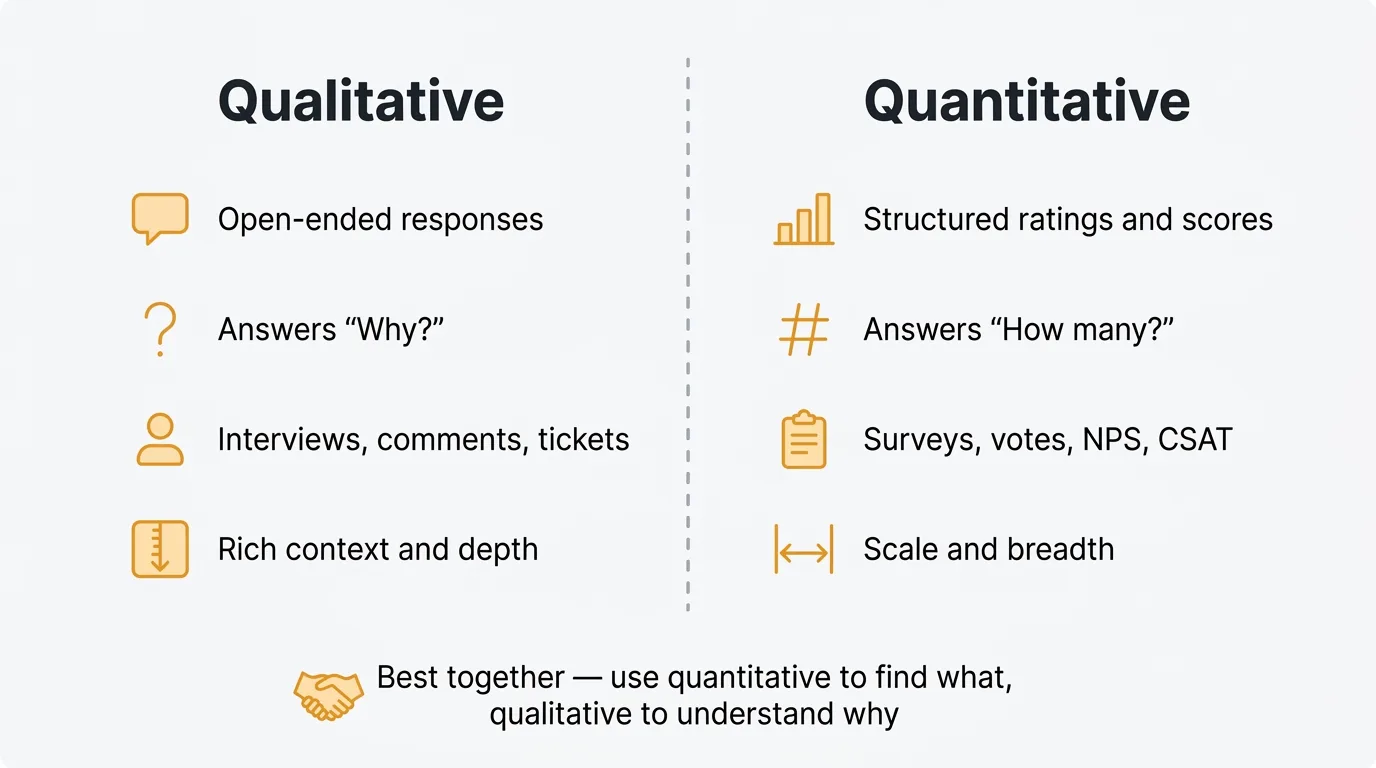
Qualitative feedback captures what users say in their own words and explains why something is happening; quantitative feedback captures structured numbers like ratings and vote counts and shows what is happening and at what scale. Use quantitative data to find what to investigate and qualitative data to understand it. The strongest feedback programs collect both in one place, so a vote and the comment behind it sit together.
What is qualitative feedback?
Qualitative feedback is open-ended. It captures what users say in their own words: free-text survey responses, support tickets, interview transcripts, feature request descriptions, and comments on a feedback board.
The strength of qualitative feedback is context. A user who writes "I gave up on the export flow because it kept timing out and I couldn't tell if my data was saved" tells you something no rating scale can. You know what broke, where in the flow it broke, and what the emotional consequence was.
The weakness is scale. Reading and categorizing hundreds of open-ended responses takes time. Without a system for tagging and summarizing, qualitative feedback piles up in inboxes and spreadsheets where it never gets used. AI-assisted analysis is changing this — automated categorization, sentiment analysis, and summarization now make qualitative data tractable at volumes that would have been impractical to analyze manually.
What is quantitative feedback?
Quantitative feedback is structured and measurable. It includes NPS scores, CSAT ratings, feature vote counts, star ratings, and Likert scale survey responses. It produces numbers you can track over time and compare across segments.
The strength is that it scales effortlessly. A thousand users can each submit a rating in seconds, and you can aggregate those ratings instantly. Trends become visible. You can spot when satisfaction drops, which features have the most demand, and how different user segments compare.
The weakness is that numbers carry no explanation. A drop in your NPS from 42 to 31 tells you something went wrong. It does not tell you what. A feature with 200 votes tells you people want it. It does not tell you why, for whom, or whether building it the way you are imagining would actually solve their problem.
Qualitative vs quantitative feedback: a comparison
| Qualitative | Quantitative | |
|---|---|---|
| Format | Open text, transcripts, comments | Ratings, scores, counts, scales |
| Collection methods | Interviews, open survey fields, support tickets, feedback comments | NPS surveys, star ratings, vote counts, Likert scales |
| Analysis approach | Tagging, thematic coding, AI summarization | Aggregation, trend tracking, segmentation |
| Strengths | Rich context, surfaces root causes, reveals unexpected issues | Scalable, comparable over time, easy to prioritize |
| Weaknesses | Hard to analyze at scale, harder to benchmark | Lacks context, can mislead without follow-up |
| Best for | Understanding why, discovery, post-churn interviews | Tracking trends, validating hypotheses, gauging demand |
When to use qualitative feedback
Use qualitative feedback when you need to understand why something is happening, not just that it is.
Early-stage discovery. Before you have a clear problem definition, qualitative feedback is your primary tool. Interviews, open-ended surveys, and informal conversations reveal what users actually struggle with — often things you would not have thought to ask about directly.
Understanding root causes. When your metrics signal a problem, qualitative feedback explains it. If your activation rate drops, reading support tickets and talking to recent churned users will surface the actual friction point faster than any A/B test.
Identifying unmet needs. Users often request features without articulating the underlying need. Qualitative feedback — especially interviews — lets you dig past the request to the job they are trying to get done. "Can you add Zapier integration?" might reveal a workflow gap that a different feature would solve better.
Post-churn interviews. When users cancel, their reasons are worth understanding in depth. Exit surveys help, but a 20-minute conversation with a churned user yields insights that a multiple-choice cancellation form never will. The candor of someone who has already left is rare and useful.
For more on methods that surface this kind of insight, see the complete guide to collecting customer feedback.
When to use quantitative feedback
Use quantitative feedback when you need to measure, compare, or track something over time.
Tracking trends. A single NPS score tells you little. A quarterly NPS trend tells you whether satisfaction is improving or declining and whether specific changes you shipped had an effect. Quantitative data only becomes meaningful when you have enough of it to see a pattern.
Prioritizing features by demand. When you have ten open feature requests and capacity for two, vote counts give you an objective signal for where to focus. A request with 300 votes is not automatically more important than one with 20 — but the gap is a real data point that belongs in your prioritization discussion. Feature voting lets users surface what matters to them without requiring a survey or interview.
Benchmarking satisfaction. Standardized metrics like NPS and CSAT are designed for comparison — against your own history, against industry benchmarks, and across different user segments. You cannot benchmark qualitative feedback in the same way. See the NPS survey template guide for how to run these surveys effectively.
Validating hypotheses. If you believe a new onboarding flow improves activation, quantitative data lets you confirm it. If you think a specific user segment is less satisfied, NPS segmented by plan type or tenure shows whether you are right. Qualitative feedback surfaces the hypothesis; quantitative feedback tests it.
How to combine both types
The most useful feedback programs use quantitative data to identify what to investigate, and qualitative data to understand why.
A practical workflow: your quarterly NPS drops four points. Quantitative data flags the problem and lets you narrow it to a specific cohort — say, users on your free plan who signed up in the last 90 days. You then run targeted interviews or add an open-ended follow-up question to that cohort's next survey. The qualitative data explains what changed in their experience and what they needed that they didn't get.
The same pattern works for feature prioritization. Vote counts on a feedback board tell you which requests have the most demand. But before you commit to building a highly-voted feature, read the comments. The top-voted request might have 200 votes but ten different underlying use cases, each requiring a different solution. The qualitative context changes how you scope the work.
Feature boards that combine voting with comment threads are the most efficient format for this. Users signal demand with a vote and explain their specific situation in the comment. You get the aggregated quantitative signal and the qualitative context in one place, without running a separate research process.
Quackback is built around this. It is an open-source feedback board (AGPL-3.0) you can self-host for free or run as a managed cloud instance, and it pairs votes with comment threads so both feedback types land in one tool. Built-in AI summarizes long comment threads, and an MCP server lets you query both your quantitative and qualitative feedback from tools like Claude.
For a deeper look at building a system that handles both, see the user feedback guide and the guide on how to ask for customer feedback.
Common mistakes
Only collecting one type. Teams that rely entirely on NPS scores miss the context behind them. Teams that only run interviews have rich insights but no way to gauge how widely they apply. Both approaches leave gaps that cost you in product decisions.
Analyzing qualitative data manually at scale. Reading 500 support tickets by hand to find patterns is slow, inconsistent, and demoralizing. At that volume, themes get missed and recency bias takes over — you remember what you read last week, not what you read three months ago. Use tagging systems and AI-assisted summarization to handle volume without losing signal.
Ignoring the context behind numbers. A CSAT score of 3.2 out of 5 on your onboarding flow is information. The reason it is 3.2 is what you need to know. Quantitative metrics should trigger qualitative investigation, not end the conversation.
Treating votes as the full picture. Feature vote counts reflect who uses your feedback board, which skews toward engaged power users. A request with 50 votes from users who each represent $500 MRR may be more important than one with 300 votes from users on a free plan. Segment your quantitative feedback the same way you would any other data.
Collecting feedback without closing the loop. Users who submit feedback and never hear back stop submitting. This applies to both types. Acknowledge requests. Publish what you are building and why. Notify users when something they voted for ships. The feedback you get from a user who knows their input matters is better than feedback from someone who expects silence.
Try Quackback — open source with a managed cloud option. Start free. Get started | View on GitHub
Frequently asked questions
Is one type of feedback more important than the other?
Neither is more important — they answer different questions. Quantitative feedback tells you what is happening and at what scale. Qualitative feedback tells you why. Treating one as a substitute for the other leads to bad decisions. A mature feedback program uses both, with each type triggering the right analysis.
How do I get qualitative feedback without running expensive interviews?
You do not need a formal research program. Open-ended fields on your NPS or CSAT survey add context with almost no extra effort. Comment threads on a feature voting board give qualitative signal at scale without scheduling. Support tickets you already receive become research assets once you tag them systematically.
How many responses do I need before quantitative feedback is reliable?
For most statistical comparisons, around 100 responses per segment is a reasonable floor; below that, outliers distort the average. If your user base is small, extend the collection window or combine survey periods. For qualitative feedback, aim for thematic saturation — when new responses stop introducing new themes.
Authored by James Morton
Founder of Quackback. Building open-source feedback tools.
Try Quackback
The open-source feedback platform. Boards, voting, and roadmaps.
Get startedStar on GitHub132