You have 500 open-ended survey responses. Reading them all takes a full day. Identifying patterns across them takes another. By the time you have findings, the moment has passed — the roadmap meeting happened, the decision was made without the data, or the follow-up survey is already in the field.
AI does that work in seconds. Not perfectly, and not without your judgment — but fast enough that you can iterate on your analysis the same afternoon you export the data.
The shift here is not about replacing researchers or product managers. It's about removing the bottleneck between collecting responses and understanding them. When analysis takes a day, you do it once. When it takes seconds, you can slice the data ten different ways, validate your interpretations, and share findings the same day you close the survey.
What is AI survey analysis
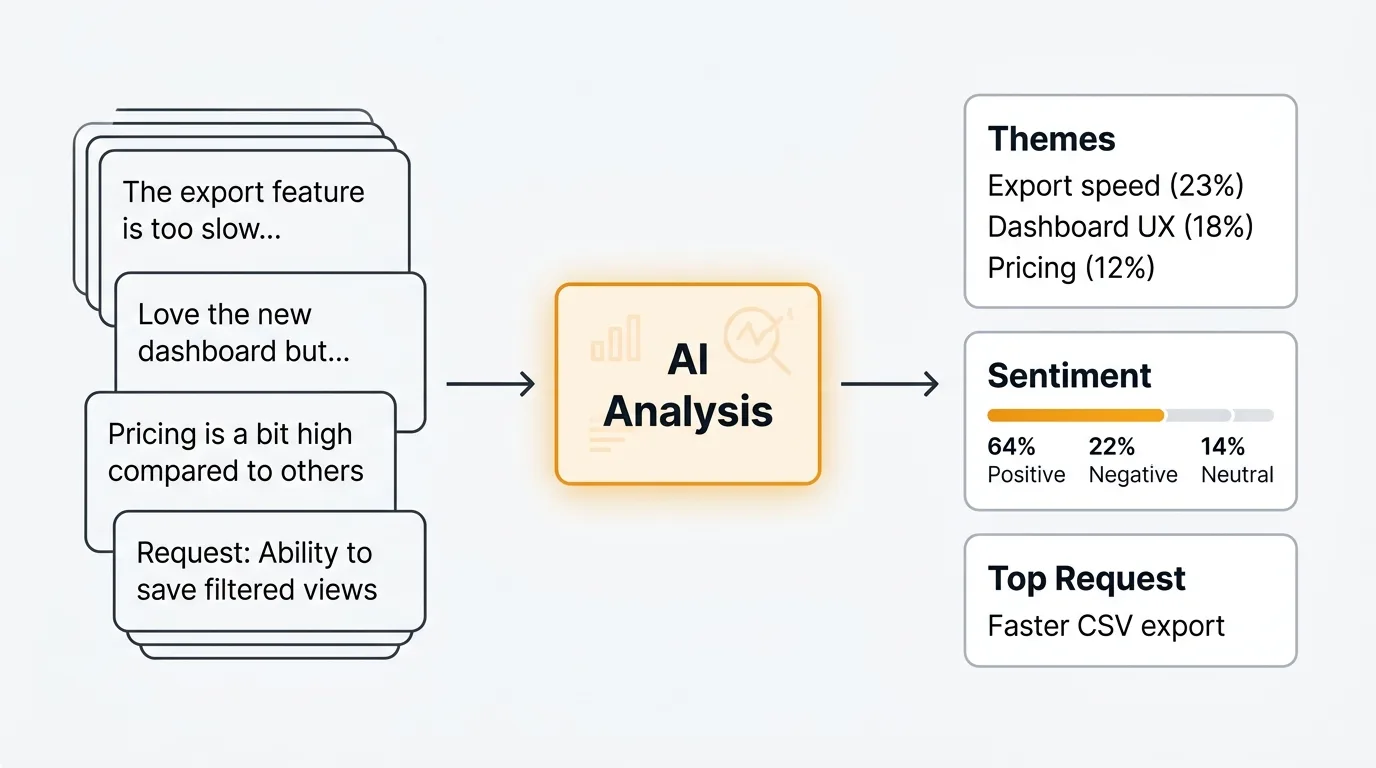
AI survey analysis means using large language models (LLMs) to read, categorize, and summarize open-ended survey responses at scale. It applies the same understanding that makes ChatGPT or Claude useful in conversation to the task of processing hundreds or thousands of text responses automatically.
The key word is open-ended. Closed-ended questions — rating scales, multiple choice, checkboxes — are easy to analyze with basic statistics. Open-ended questions like "What's the biggest thing holding you back?" or "What would you tell a colleague about our product?" require reading comprehension. That's where AI earns its place.
AI survey analysis is not a replacement for human judgment. The model reads and categorizes. You decide what the categories mean, which themes matter, and what to do about them. The analysis augments your thinking — it handles the volume so you can focus on interpretation.
For a broader look at how this fits into your feedback workflow, see our guide to AI customer feedback analysis.
What AI can do with survey data
Sentiment analysis
AI classifies each response as positive, negative, or neutral — and modern models can go further, detecting frustration, enthusiasm, resignation, or uncertainty within a single response. This lets you filter your data by emotional tone before you start reading.
For survey analysis, sentiment is most useful as a triage layer. If you have 500 responses and want to understand what's driving negative sentiment, you can filter to the 120 negative responses and analyze those specifically, rather than reading all 500 to find the pattern.
Topic clustering
Topic clustering groups responses by theme without you defining the categories in advance. You give the model 500 responses and it returns a structured list of themes — "integration requests," "pricing concerns," "onboarding friction" — with the responses that belong to each group.
This is the most valuable capability for large volumes of data. Instead of reading responses and building a taxonomy manually, you get a working draft of the theme structure automatically. Your job is to review the clusters, rename them where needed, and merge or split any that don't reflect your understanding of the data.
Keyword extraction
Keyword extraction surfaces the concepts that appear most frequently across your responses. Terms like "slow," "missing," "confusing," or "love" signal what users are focused on. You see the vocabulary your users actually use, which is useful for communicating findings back to users in their own words.
Keyword extraction is a fast first pass. It does not capture meaning — a response saying "I love that it's slow" and a response saying "it's too slow" would both contribute "slow" to the keyword list. Use it alongside sentiment analysis for more accurate signal.
Duplicate detection
Surveys often produce dozens of responses that express the same idea in different words. "The onboarding took too long," "setup was confusing," and "I didn't understand how to get started" are all the same theme. AI detects semantic similarity — it understands that these responses are related even though they share no keywords.
Identifying duplicates early means you are not counting the same feedback multiple times when you report on volume. It also makes clustering cleaner, because you are working with distinct ideas rather than repeated variations of a small number of themes.
Summary generation
AI can compress hundreds of responses into a concise summary that captures the main themes, supporting quotes, and distribution of opinions. Instead of attaching a spreadsheet to your findings deck, you share a structured summary with representative examples.
Good summaries include three things: the dominant themes, the minority views that deserve attention, and direct quotes from responses. Quotes matter because they bring the voice of the respondent into the analysis — stakeholders respond differently to data with faces on it.
Trend detection
If you run surveys at regular intervals — quarterly NPS, monthly satisfaction checks, post-release surveys — AI can compare results across waves and flag emerging themes. A topic that appears in 5% of responses in Q3 and 18% in Q4 is worth investigating, even if it never surfaces in your top-five themes.
Trend detection requires consistent question wording and structured data across waves. It's the most valuable capability for teams with longitudinal data, and the one that most manual analysis processes miss entirely.
How to analyze survey results with AI
Step 1: Export your data
Export responses to CSV or plain text. Most survey tools — Typeform, Google Forms, Tally, SurveyMonkey — support CSV export. You want one column per question and one row per respondent.
If you are analyzing one question at a time (recommended), create a separate file or copy just that column's responses.
Step 2: Clean the responses
Remove blank responses, test submissions, and anything under five words. Standardize the format: one response per line, no quotation marks wrapping the text if possible. Remove any personally identifiable information before passing data to an external AI system.
Cleaning takes five minutes and significantly improves output quality. Garbage in, garbage out applies more to AI analysis than to almost anything else.
Step 3: Choose your analysis type
Decide what you need before you write a prompt. Sentiment classification, topic clustering, keyword extraction, summarization, and comparison analysis each require different prompts. Do not ask for everything in one request — you get better results from focused, specific prompts than from broad "analyze this" instructions.
Step 4: Run the analysis
Paste your responses into ChatGPT, Claude, or your AI tool of choice alongside your prompt. For larger datasets, you may need to process responses in batches of 50-100 at a time, depending on context limits.
For tools with API access, you can automate this step and process all responses in a single script. The prompts in the next section work for both manual and automated analysis.
Step 5: Interpret results
Read the output critically. Check whether the categories make sense. Look for themes the AI may have lumped together that your domain knowledge tells you are distinct. Note what the AI missed or misclassified.
The output is a draft, not a final analysis. It gives you a structured starting point that would have taken hours to produce manually.
Step 6: Validate with spot-checks
Pick 20-30 responses at random and check whether the AI's classifications match your own judgment. If sentiment is wrong on 1 in 10 responses, that's a 10% error rate — acceptable for many use cases, but worth noting in your findings. If topic clustering puts clearly unrelated responses in the same bucket, adjust your prompt and re-run.
Validation is not optional. Presenting AI-generated analysis without checking it is how confident-sounding errors end up in stakeholder decks.
Example prompts for survey analysis
Categorize responses into themes
Use this when you want to understand the main topics across a large set of open-ended responses.
You are analyzing open-ended survey responses. Here are [N] responses to the question: "[Your question here]"

[Paste responses, one per line]

Identify the 5-8 most common themes across these responses. For each theme:
- Give it a concise name
- Write a one-sentence description of what it covers
- List the response numbers that belong to it
- Note the approximate percentage of total responses it represents

Return the themes ranked by frequency, most common first.
Extract sentiment with confidence scores
Use this when you need to triage responses by emotional tone before doing deeper analysis.
Classify the sentiment of each survey response below as Positive, Negative, or Neutral. Also provide a confidence score from 1-5 (1 = uncertain, 5 = highly confident).

Format your response as a table with columns: Response Number | Sentiment | Confidence | Brief reason

Responses:
[Paste responses, numbered 1, 2, 3...]
Summarize top themes with representative quotes
Use this to produce a shareable summary of findings for stakeholders who will not read the raw data.
Here are [N] responses to the survey question: "[Your question here]"

[Paste responses]

Produce a structured summary with:
1. The 5 most prominent themes, ranked by frequency
2. For each theme: a 2-3 sentence description of what respondents are saying
3. 2-3 direct quotes from the responses that best represent each theme (preserve exact wording)
4. A note on any minority views that appear in fewer than 10% of responses but deserve attention

Keep the summary concise enough to fit in a slide or a short document section.
Compare responses between user segments
Use this when you have survey data from two different groups and want to understand how their responses differ. This is particularly useful for qualitative vs quantitative feedback analysis workflows.
I have open-ended survey responses from two user segments responding to the same question: "[Your question here]"

Segment A ([describe who they are]):
[Paste Segment A responses]

Segment B ([describe who they are]):
[Paste Segment B responses]

Compare the two segments:
1. What themes appear in both segments?
2. What themes are unique to Segment A?
3. What themes are unique to Segment B?
4. How does the sentiment differ between the two segments?
5. What is the single most important difference in how these groups responded?
Identify feature requests vs bug reports vs praise
Use this when analyzing support surveys, post-purchase surveys, or NPS follow-up questions where responses mix different types of feedback.
Classify each response below into one of four categories:
- Feature request: The respondent wants something that does not currently exist
- Bug report: The respondent is describing something that is broken or not working as expected
- Praise: The respondent is expressing satisfaction or appreciation
- Other: None of the above

For each response, provide: Response number | Category | One-sentence summary of the specific item

Responses:
[Paste responses, numbered]

After the classifications, provide a count of how many responses fall into each category.
Extract top keyword concepts
Use this as a fast first pass when you want to see the vocabulary your respondents are using before doing deeper analysis.
Read these [N] survey responses and extract the 20 most significant concepts or keywords across all of them.

[Paste responses]

For each keyword or concept:
- List the term
- Note approximately how many responses mention it
- Indicate whether it appears in a positive, negative, or neutral context most often

Group the keywords by theme if natural groupings are apparent.
AI survey analysis tools
Quackback
Quackback is built for ongoing feedback collection and analysis rather than one-time survey processing. It includes built-in sentiment analysis, duplicate detection, and AI summaries for every piece of feedback on your board. You connect your own LLM API key, so there are no per-use charges from Quackback.
Where Quackback is particularly useful for survey workflows is the MCP server, which lets AI agents in Claude, Cursor, and other tools interact with your feedback data directly. If you run regular surveys and want to track themes over time, Quackback gives you a structured environment that manual prompt-based analysis does not. For NPS survey follow-up responses or customer satisfaction survey open-ends, the ongoing analysis workflow fits well.
ChatGPT and Claude
The prompts in this post work directly in ChatGPT or Claude's web interface. Paste your responses, add your prompt, and get structured output in seconds. This is the right approach for one-time analyses or teams that do not yet have a dedicated feedback tool.
The limitation is scale. Free and standard tiers have context window limits that constrain how many responses you can process at once. For large surveys, you will process responses in batches and combine the outputs manually. Claude's extended context window (up to 200K tokens on paid plans) handles larger batches than most alternatives.
MonkeyLearn
MonkeyLearn is a text analysis API that offers pre-trained sentiment and topic classification models, plus the ability to train custom classifiers on your own data. It integrates with Zapier, Make, and most survey tools directly.
The trade-off is setup time. Pre-trained models work reasonably well out of the box, but getting high accuracy on domain-specific feedback usually requires training a custom model — which requires labeled training data. MonkeyLearn is a good choice for teams with recurring, high-volume analysis needs who want a more automated pipeline than manual prompting.
Thematic
Thematic is a purpose-built survey analysis tool designed specifically for open-ended response analysis. It identifies themes automatically, tracks them across survey waves, and produces structured reports with trend data. Pricing is higher than general-purpose AI tools, but the workflow is more polished for survey-specific use cases.
Thematic is worth evaluating if you run large-scale surveys regularly (thousands of responses per wave) and need presentation-ready output rather than raw analysis you format yourself.
Limitations of AI survey analysis
AI survey analysis is useful, but it is not infallible. Understanding the limitations helps you use it well rather than trust it blindly.
Nuance requires human review. AI models handle direct, literal feedback well. They struggle with sarcasm, irony, and responses where the meaning depends on cultural or organizational context. A response like "great, another update that breaks my workflow" reads as negative to a human but may be misclassified by a model that weights "great" positively. Review a sample of classifications yourself before presenting findings.
Sample size matters. Topic clustering on 50 responses produces noisy, over-broad categories. The same analysis on 500 responses produces meaningful, stable themes. AI amplifies the signal in your data — if there is not much signal, the output will not be useful. There is no substitute for sufficient response volume.
Prompt engineering affects quality. The prompts in this post are a starting point, not finished tools. The quality of AI output depends heavily on how you frame the task, how much context you provide, and how specifically you define what you want. Expect to iterate on prompts before you get output you are comfortable sharing.
Categorizations can be wrong. AI assigns responses to categories based on pattern matching, not understanding. A response about "slow customer support" and a response about "slow load times" might both be classified under "performance" if your prompt is not specific about what performance means in your context. Check the edges of every category.
Do not skip validation. The most common mistake with AI analysis is presenting the output as findings without checking it. Spot-check a random sample of every analysis before you share it. A 5-10% error rate is acceptable in many contexts; finding that rate after presenting findings is not.
Frequently asked questions
Can AI analyze survey responses accurately?
For straightforward sentiment classification and topic clustering, modern LLMs produce reliable results — typically 85-95% accuracy on clear, direct feedback. Accuracy drops on sarcasm, nuanced language, and responses that require domain knowledge to interpret correctly. The practical approach is to use AI for the first pass and validate with a manual spot-check of 20-30 responses. If the error rate is acceptable for your use case, proceed. If not, refine your prompt and re-run.
How many survey responses do I need for AI analysis to be useful?
AI analysis adds the most value at scale, but there is no hard minimum. Even 50 responses benefit from AI sentiment classification and keyword extraction. Topic clustering becomes meaningful around 100-150 responses, where natural themes start to emerge with enough examples to be reliable. Trend detection across survey waves typically requires at least 200 responses per wave to produce stable results. Below 50 responses, manual reading is usually faster and more accurate than AI analysis.
Is it safe to paste survey responses into ChatGPT or Claude?
It depends on what the responses contain and what your privacy commitments are to respondents. If responses contain personally identifiable information (names, email addresses, company names), remove that before pasting. Check whether you promised anonymity in your survey consent language. OpenAI and Anthropic both offer options to opt out of using your data for model training — check the settings in your account and review the terms of service for your plan. For sensitive surveys (healthcare, HR, legal), use API access with a data processing agreement in place, or run a local model.
Authored by James Morton
Founder of Quackback. Building open-source feedback tools.
Try Quackback
The open-source feedback platform. Boards, voting, and roadmaps.
Get startedStar on GitHub132