NPS distills customer loyalty into a single number. One question, one scale, one score. But the number itself is not the point. The follow-up — what you ask after the score, how you distribute the survey, and what you do with the results — determines whether NPS actually improves your product.
Most teams send the NPS question and stop there. They get a score, compare it to an industry benchmark, and move on. The score tells you how users feel. The follow-up tells you why. This guide provides complete NPS survey templates, follow-up questions for every segment, and practical advice on timing, distribution, and closing the loop.
The NPS question
The standard Net Promoter Score question is:
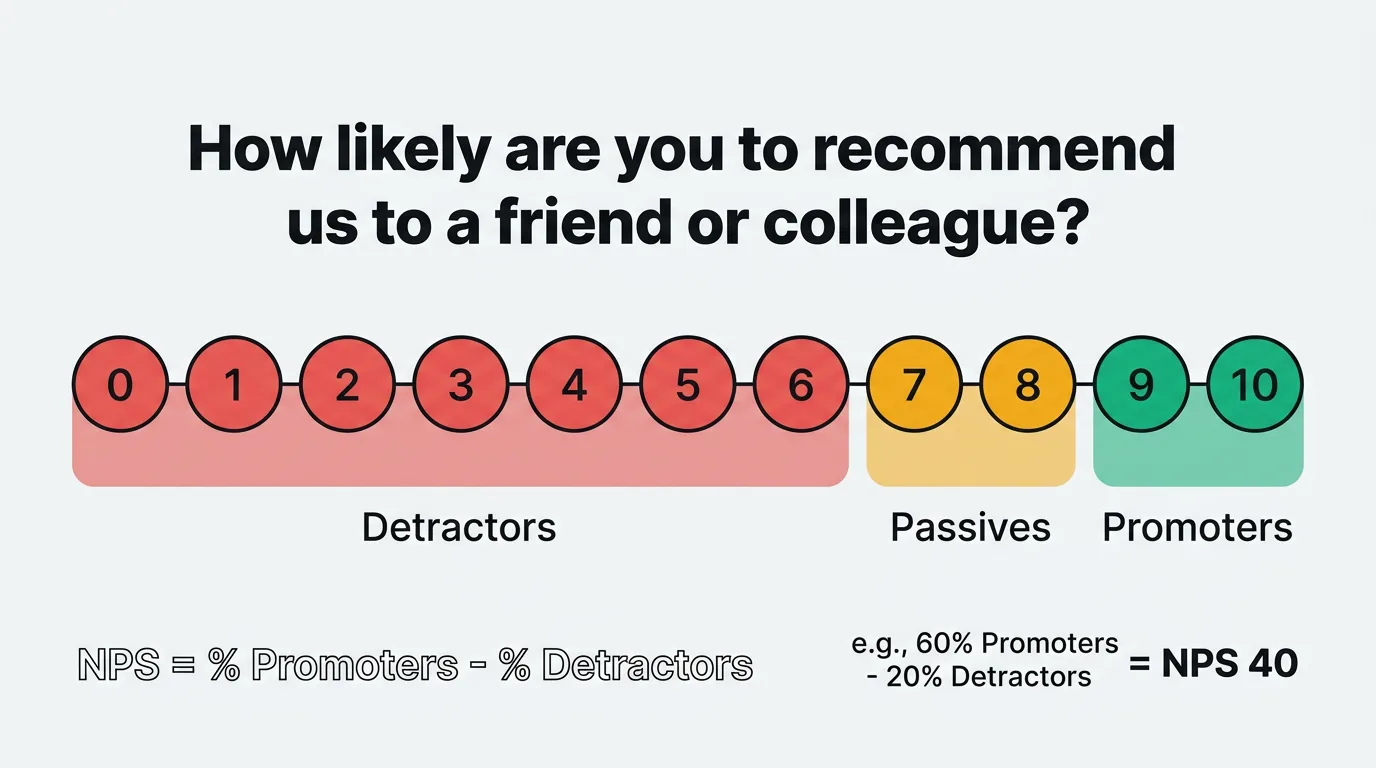
"How likely are you to recommend [Product/Company] to a friend or colleague?"
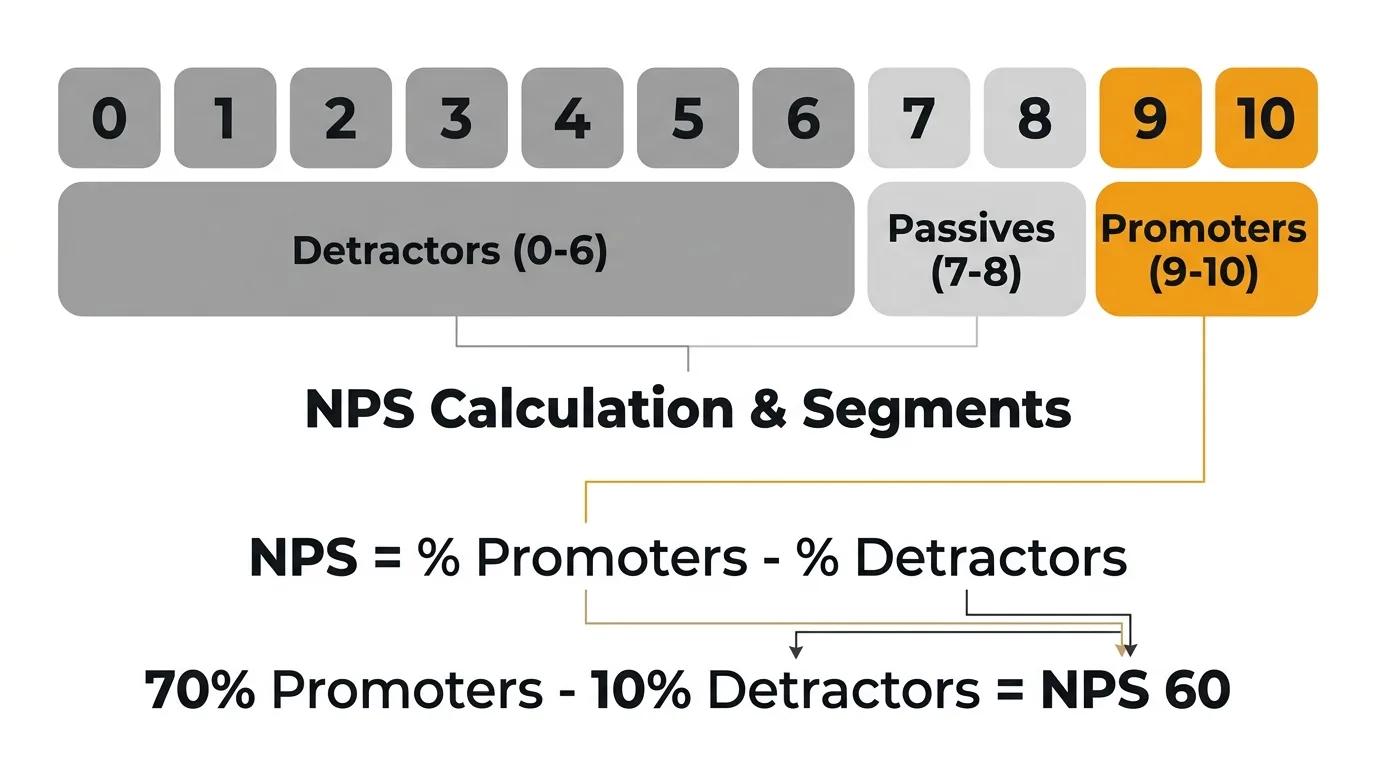
Users respond on a scale of 0 to 10. Their responses place them into three groups:
- Promoters (9-10): Loyal users who actively recommend your product.
- Passives (7-8): Satisfied but not enthusiastic. Vulnerable to competitors.
- Detractors (0-6): Unhappy users who may discourage others from using your product.
Your NPS is calculated by subtracting the percentage of detractors from the percentage of promoters. The result ranges from -100 to +100. Use the NPS calculator to compute your score and see how it compares to industry averages.
The question itself should not be modified significantly. Changing the wording or the scale undermines the ability to benchmark your score against other companies and against your own historical data. Where you have flexibility — and where most of the value lives — is in what you ask next.
Follow-up questions by segment
The NPS score tells you who is happy and who is not. The follow-up question tells you what to do about it. Tailor your follow-up based on which segment the respondent falls into.
Promoters (9-10)
Promoters already like your product. Your goal is to understand what drives their loyalty and turn that enthusiasm into something concrete — a review, a referral, or a case study.
"What do you like most about [Product]?"
"Which feature or aspect of [Product] has had the biggest impact on your work?"
"Would you be willing to leave us a review on [G2/Capterra/etc.]?"
"Is there anyone on your team who might also benefit from [Product]?"
Don't take promoters for granted. Their answers reveal what to protect and double down on. If ten promoters all mention the same feature, that feature is load-bearing — do not deprioritize it.
Passives (7-8)
Passives are the most underserved segment. They're satisfied enough to stay, but not satisfied enough to recommend you. A small improvement could turn them into promoters. A competitor's pitch could turn them into churned users.
"What would make you rate us a 9 or 10?"
"What's one thing we could improve about [Product]?"
"Is there a feature or capability you feel is missing?"
"How does [Product] compare to other tools you've used for this purpose?"
Passive responses are a roadmap for incremental improvements. The gap between a 7 and a 9 is often specific and fixable — a missing integration, a clunky workflow, a pricing concern.
Detractors (0-6)
Detractors have something specific to tell you. Make it easy for them. The follow-up should be open-ended enough to capture the real issue, not defensive or leading.
"What's the main reason for your score?"
"What could we do to improve your experience with [Product]?"
"What was the most frustrating part of using [Product]?"
"Would you be open to a brief conversation so we can better understand your experience?"
Detractor feedback is the most actionable feedback you will receive. It points directly at problems. Respond to it personally when possible — a human reply to a detractor can reverse their sentiment entirely.
NPS survey templates
The NPS question and follow-up work differently depending on context. Here are four complete templates for common scenarios.
Post-onboarding NPS
Send 7-14 days after a new user completes onboarding. This captures first impressions while the experience is fresh.
Question 1: "Now that you've been using [Product] for a week, how likely are you to recommend it to a friend or colleague?" (0-10)
Question 2 (if 9-10): "What stood out most during your first week with [Product]?"
Question 2 (if 7-8): "What would have made your onboarding experience better?"
Question 2 (if 0-6): "What was the biggest challenge you faced getting started with [Product]?"
Question 3 (optional): "Is there anything else you'd like us to know?"
Post-onboarding NPS reveals whether your activation flow delivers on the promise your marketing made. A low score here often means the gap between expectation and reality is too wide. It is also the earliest signal of potential churn. Expect response rates of 20-30% when sent at the right moment during onboarding.
Quarterly relationship NPS
Send to your entire active user base once per quarter. This is your benchmark — the score you track over time to measure overall product health.
Question 1: "How likely are you to recommend [Product] to a friend or colleague?" (0-10)
Question 2: "What's the primary reason for your score?"
Question 3 (if 9-10): "Would you be open to sharing your experience in a short review or case study?"
Question 3 (if 0-6): "Would you be open to a brief call so we can learn how to improve?"
Keep quarterly NPS minimal. Two to three questions maximum. The goal is a high response rate and consistent data over time. Adding extra questions lowers completion rates and makes quarter-over-quarter comparisons harder. Target a 15-25% response rate. If yours is below 10%, the survey may be reaching users at the wrong time or too frequently.
Post-support NPS
Send within 24 hours of a support ticket being resolved. This measures whether your support experience strengthens or weakens loyalty.
Question 1: "Based on your recent support experience, how likely are you to recommend [Product] to a friend or colleague?" (0-10)
Question 2 (if 9-10): "What did our support team do well?"
Question 2 (if 7-8): "How could we have made your support experience better?"
Question 2 (if 0-6): "What went wrong during your support experience?"
Post-support NPS is distinct from CSAT, which measures satisfaction with the specific interaction. NPS after support tells you whether the interaction changed the user's overall perception of your product. Both are worth measuring, but they answer different questions. Expect response rates of 25-35% when sent within 24 hours of resolution.
Feature-specific NPS
Send after a user has had meaningful exposure to a new feature — typically 2-4 weeks after launch.
Question 1: "Now that you've used [Feature Name], how likely are you to recommend [Product] to a friend or colleague?" (0-10)
Question 2: "How has [Feature Name] impacted your workflow?"
Question 3 (if 0-8): "What would make [Feature Name] more useful for you?"
Feature-specific NPS tells you whether a new capability is moving the needle on overall loyalty. A feature that users like but doesn't lift NPS may be solving a low-priority problem. A feature that lifts NPS among a specific segment tells you where to invest next.
When to send NPS surveys
Timing determines response rates, data quality, and whether users perceive your survey as helpful or annoying.
After onboarding (7-14 days). Early enough that the experience is fresh. Late enough that the user has formed a real opinion. Sending on day one captures setup frustration, not product sentiment.
Quarterly for relationship NPS. Once every 90 days is the standard cadence. It provides enough data points to identify trends without exhausting your users. Pick a consistent week each quarter and stick to it.
After major interactions. Support resolution, a large feature launch, a plan upgrade or downgrade. These moments create strong opinions — capture them while they're fresh.
Avoid survey fatigue. Never send NPS to the same user more than once per quarter. If a user receives a post-support NPS survey in March, exclude them from the quarterly send in March. Stack overlapping surveys and users will ignore all of them.
Consider the day and time. Midweek, mid-morning emails consistently get the highest open and response rates. Avoid Mondays (inbox overload) and Fridays (users are checked out). For in-app surveys, trigger them during active sessions — not at login, when users are focused on getting to their work.
NPS survey distribution channels
How you deliver the survey affects who responds and how thoughtfully they respond.
The most common distribution method. Email works well for quarterly relationship NPS because it reaches users regardless of how active they are in your product. Include the 0-10 scale directly in the email body so users can click their score without opening a new page. One-click response significantly increases completion rates.
In-app surveys
In-app distribution captures feedback during active use. The context is richer — the user is inside your product, experiencing it in real time. Tools like the Quackback widget let you trigger NPS surveys based on user behavior, time in product, or milestones reached. In-app surveys consistently produce higher response rates than email for active users — often 30-40% compared to 15-25% for email.
Slack and messaging integrations
For teams that live in Slack or Microsoft Teams, delivering NPS surveys where they already work reduces friction. This works particularly well for B2B products where the buyer and user communicate through shared channels.
Embedded in product flows
Embed NPS questions at natural pause points in your product. After completing a task, after exporting a report, after closing a project. The key is choosing moments where the user has just accomplished something and has a moment to reflect. Avoid interrupting active workflows.
What to do with NPS results
Collecting NPS data without acting on it is a waste of everyone's time — yours and your users'. The score is a starting point, not an endpoint.
Close the loop with respondents
Every detractor who leaves a comment should get a personal response. Not a canned email — a real reply from someone who read what they wrote and wants to help. This is the highest-leverage action you can take with NPS data. Users who feel heard often revise their opinion even before you fix the problem.
For promoters, a simple thank-you and a link to leave a review converts enthusiasm into social proof. For passives, acknowledge their feedback and let them know you are working on improvements they mentioned.
Feed insights into your feedback system
NPS responses should not live in a spreadsheet that gets reviewed once a quarter. Route them into your feedback board where they can be categorized, tagged, and prioritized alongside feature requests, support insights, and other input. When five detractors all mention the same pain point, that should surface as a clear priority — not get lost in a CSV.
For a deeper look at how to build this process, see our guide on building a customer feedback loop.
Track trends over time
A single NPS score is a snapshot. The trend is what matters. Track your score quarterly and segment it by user cohort, plan type, and tenure. A declining score among new users tells a different story than a declining score among long-tenured accounts. The first suggests an onboarding problem. The second suggests your product is not keeping up with expectations.
Connect NPS to action
Map recurring themes from NPS responses to your product roadmap. If detractors consistently cite a specific gap, that gap should appear on your roadmap with a clear priority. When you ship the fix, notify the users who raised it. This closes the feedback loop and converts detractors into users who feel invested in your product's direction. Use feature voting to validate whether the themes you see in NPS data match broader user demand.
Frequently asked questions
What is a good NPS score?
It depends on your industry and stage. For B2B SaaS, scores above 30 are considered good. Above 50 is excellent. Above 70 is world-class. But your most useful benchmark is your own history. A score of 25 that is trending upward is healthier than a score of 40 that is declining. Focus on the trend and on the qualitative feedback behind the number.
How many responses do I need for a reliable NPS score?
A minimum of 100 responses gives you a statistically meaningful score with a reasonable margin of error. Below that, individual outliers skew the result significantly. If your user base is small, extend the collection window or combine multiple survey periods before drawing conclusions. For larger user bases, aim for a response rate above 20% to ensure the sample represents your full user population.
Should I use NPS or CSAT?
They measure different things. NPS measures overall loyalty and likelihood to recommend. CSAT measures satisfaction with a specific interaction or experience. Use NPS for quarterly health checks and trend tracking. Use CSAT for evaluating specific touchpoints like support, onboarding, or feature launches. Most teams benefit from running both. For a broader look at feedback collection methods and when to use each, see our guide to collecting customer feedback.
Can I customize the NPS question?
You can add context — for example, "Based on your experience over the past 90 days..." — but avoid changing the core structure or the 0-10 scale. The standard wording exists so you can benchmark your score against industry data and track it consistently over time. If you need to measure something more specific, use a CSAT survey or a custom question alongside NPS, not instead of it. Our user feedback guide covers how to combine multiple feedback methods into a coherent program.
Authored by James Morton
Founder of Quackback. Building open-source feedback tools.
Try Quackback
The open-source feedback platform. Boards, voting, and roadmaps.
Get startedStar on GitHub132