Customers do not want to be delighted. They want things to be easy.
That is not a motivational poster. It is the conclusion of a Harvard Business Review study of 75,000 customer interactions. The researchers found that exceeding expectations had almost no impact on loyalty. What mattered was reducing friction. The study, titled "Stop Trying to Delight Your Customers," led to the creation of Customer Effort Score (CES) — a metric designed to measure how easy or difficult it is for customers to get what they need.
What CES measures
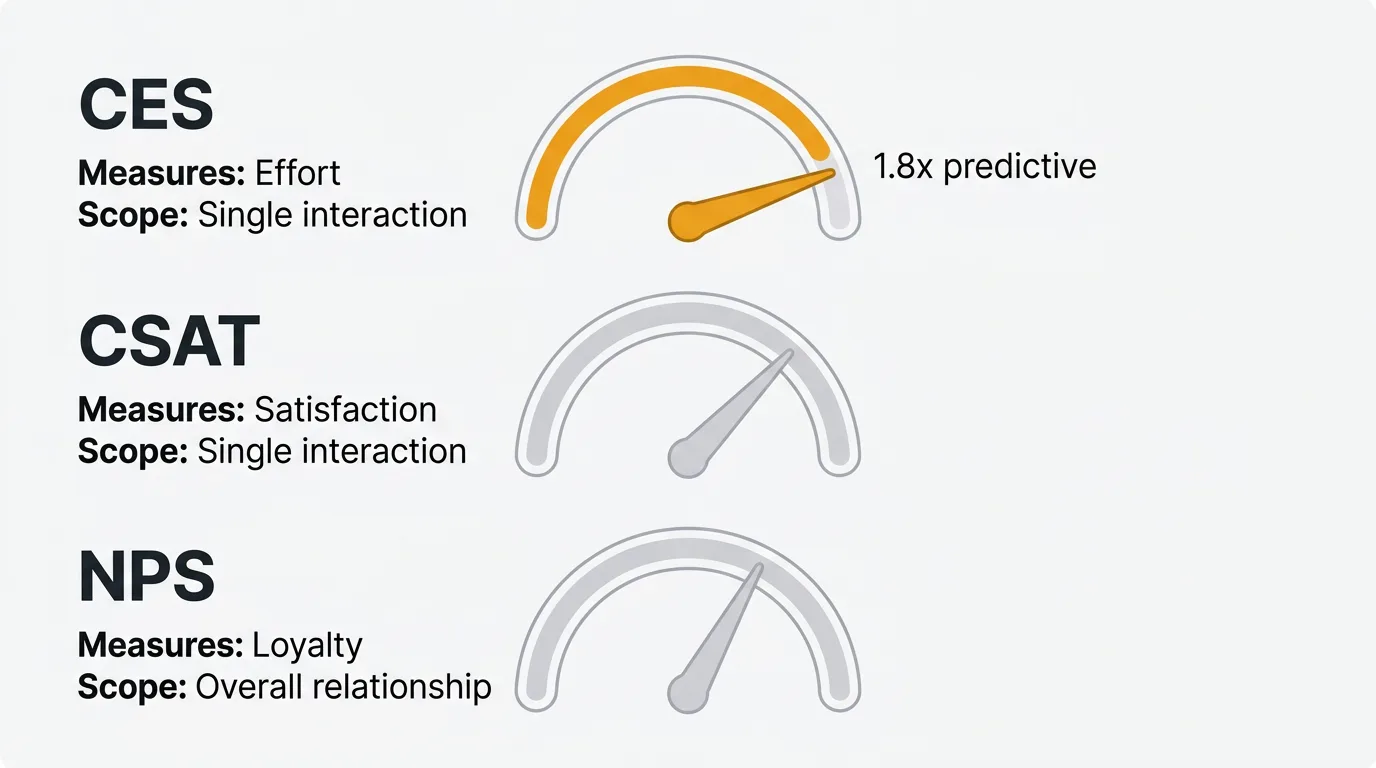
CES measures the effort a customer expends to complete a specific interaction with your company. Not their overall satisfaction. Not their loyalty. Just how easy or hard one particular interaction was.
This makes CES fundamentally different from NPS and CSAT:
| CES | CSAT | NPS | |
|---|---|---|---|
| Measures | Effort to complete a task | Satisfaction with an interaction | Likelihood to recommend |
| Scope | One specific interaction | One specific interaction | Overall relationship |
| Question | "[Company] made it easy for me to handle my issue" | "How satisfied were you?" | "How likely are you to recommend us?" |
| Scale | 1-7 (disagree to agree) | 1-5 (unsatisfied to satisfied) | 0-10 |
| Predicts | Churn and disloyalty | Short-term satisfaction | Revenue growth |
| Predictive power | 1.8x more than CSAT for loyalty | Moderate | High for revenue |
The key finding: CES is 1.8 times more predictive of customer loyalty than CSAT and twice as predictive as NPS. Effort is a better proxy for whether someone will stay or leave than how happy or how likely to recommend they say they are.
For a deeper comparison with CSAT and NPS, including survey templates for each, see our guides on CSAT surveys and NPS surveys.
The CES question and scale
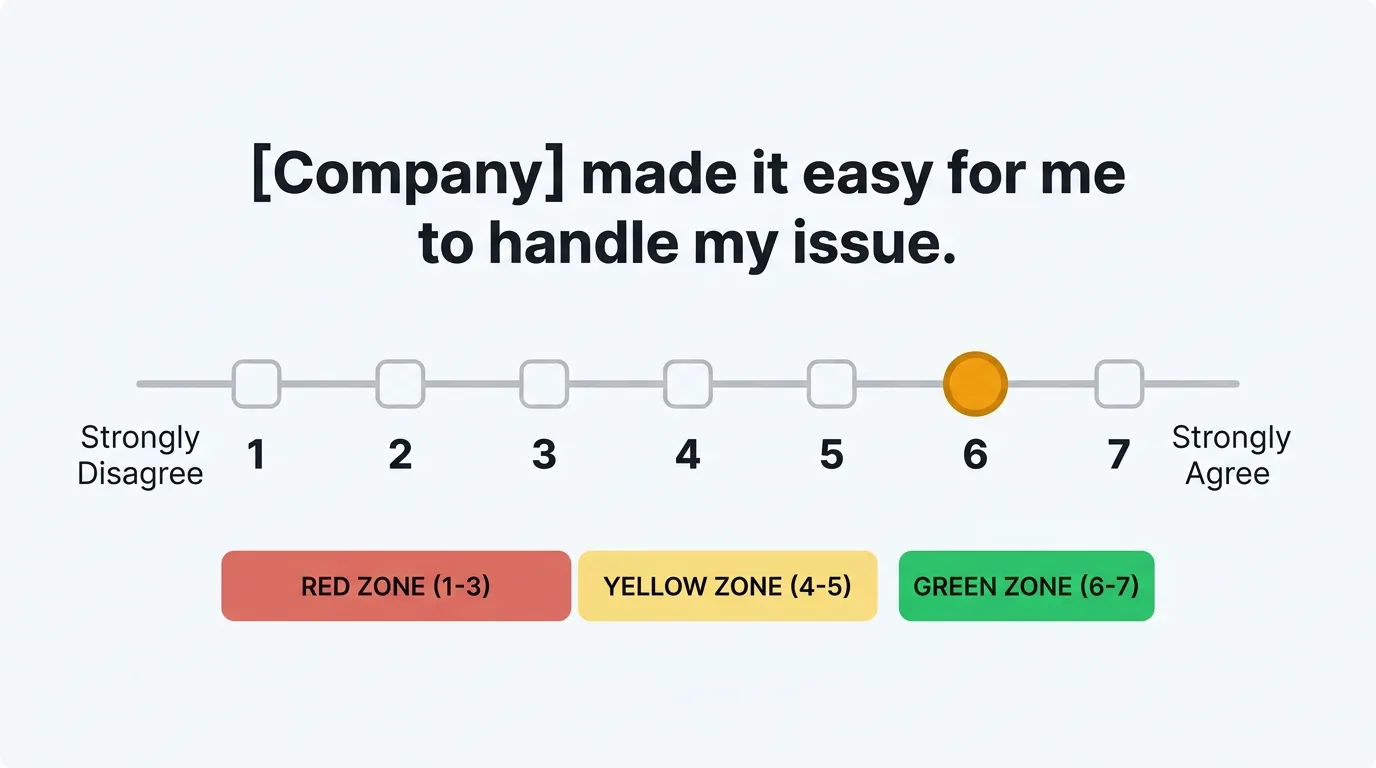
The current standard (CES 2.0) uses a statement format:
"[Company name] made it easy for me to [handle my issue / complete my purchase / get started]."
Respondents rate their agreement on a 7-point scale:
- Strongly Disagree
- Disagree
- Somewhat Disagree
- Neither Agree nor Disagree
- Somewhat Agree
- Agree
- Strongly Agree
Calculation: CES = Sum of all scores / Number of responses
A CES of 5.0 or above is generally good. A CES of 6.0 or above is excellent. Below 4.0 signals significant friction and high churn risk.
Best practice: Pair the CES rating with one open-ended follow-up: "What could we have done to make this easier?" This gives you the score for tracking and the context for fixing.
When to deploy CES surveys
CES surveys must be triggered by a specific interaction, not sent on a schedule. Context decays quickly — a survey sent five minutes after a support resolution captures more accurate data than one sent three days later.
After support interactions
The highest-value touchpoint for CES. Trigger immediately after a support ticket is resolved or a live chat ends.
Question: "[Company] made it easy for me to resolve my issue."
After onboarding
Trigger after a user completes onboarding or reaches a defined activation milestone.
Question: "[Company] made it easy for me to get started."
After self-service
Trigger after a user visits your help center, knowledge base, or self-service help center.
Question: "Was it easy to find the information you needed?"
After key feature interactions
Trigger after a user completes a critical workflow for the first time.
Question: "How easy was it to use [feature name]?"
After purchase or checkout
Trigger immediately after purchase completion.
Question: "[Company] made it easy for me to complete my purchase."
What the data says about effort and loyalty
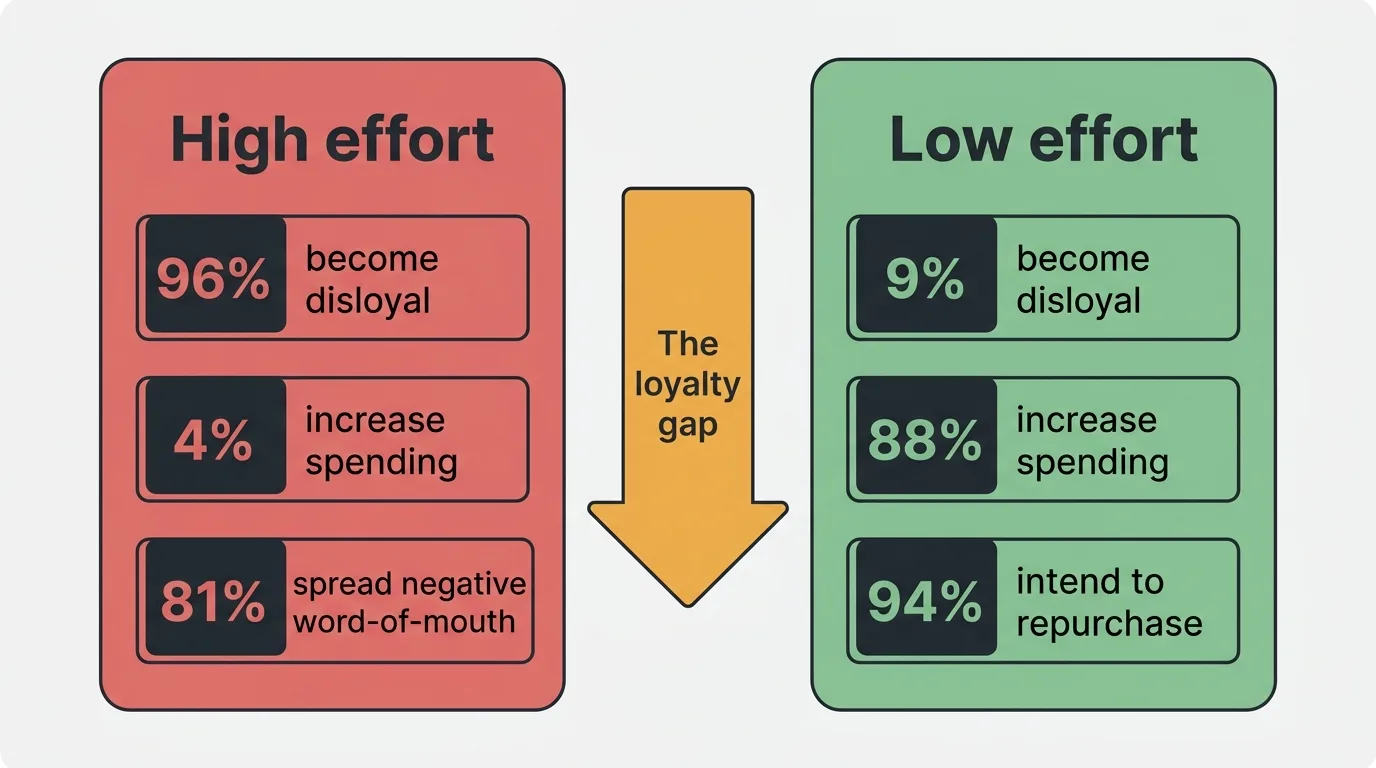
The Gartner/CEB research that underpins CES is among the most cited in customer experience:
- 96% of customers with high-effort experiences become disloyal
- Only 9% of customers with low-effort experiences become disloyal
- 94% of low-effort customers intend to repurchase
- 88% of low-effort customers intend to increase spending
- Only 4% of high-effort customers intend to increase spending
- 81% of high-effort customers plan to spread negative word-of-mouth
- Low-effort experiences reduce repeat calls by 40%, escalations by 50%, and channel switching by 54%
The asymmetry is striking. Reducing effort from high to low flips the loyalty equation almost entirely. The business case for measuring and reducing effort is one of the strongest in customer experience.
How to improve CES scores
Reduce channel switching
Every time a customer is forced to switch channels — from chat to phone, from email to a form, from self-service to a ticket — effort increases. Let customers resolve issues in the channel they started in.
Achieve first-contact resolution
Train support teams to resolve issues in one interaction. The Gartner data shows first-contact resolution reduces repeat calls by 40%, escalations by 50%, and channel switching by 54%. This is the single highest-leverage improvement for CES.
Invest in self-service
FAQ pages, knowledge bases, in-app help, and chatbots let customers solve problems without waiting for a human. Most customers prefer self-service when it works. The key phrase is "when it works" — a bad self-service experience (irrelevant search results, outdated articles, broken links) is worse than no self-service at all.
Eliminate repetition
Do not make customers repeat their issue to multiple agents. Pass context between channels and agents automatically. If a customer explained their problem in chat, the phone agent should already know what happened.
Simplify processes
Count the number of steps to complete any task — checkout, returns, account setup, feature configuration. Then reduce them. Every unnecessary step is effort. Every unnecessary form field is effort. Audit for redundancy.
Be proactive
Anticipate common issues and address them before the customer has to ask. Proactive notifications, status updates, and known-issue banners reduce inbound effort. A changelog that tells customers about fixes before they notice the problem is effort prevention.
Close the loop on CES feedback
When a customer reports high effort, follow up. Fix the root cause. Track CES by touchpoint to identify which interactions generate the most friction. A feedback system that connects CES responses to specific product areas makes it possible to prioritize improvements by the effort they create.
CES benchmarks
There is no universal cross-industry benchmark because scales, wording, and industries vary. The most useful approach is to track your own CES over time and benchmark against yourself.
That said, general guidelines on a 7-point scale:
| Score range | Interpretation |
|---|---|
| 6.0-7.0 | Excellent — low friction, high loyalty |
| 5.0-5.9 | Good — room for improvement but not alarming |
| 4.0-4.9 | Mediocre — noticeable friction, improvement needed |
| Below 4.0 | Poor — high effort, high churn risk |
By industry: SaaS and e-commerce tend to score higher (more automation, fewer handoffs). Healthcare, government, and complex B2B services score lower (more process, more human involvement).
Trending matters more than absolute score. A CES of 5.2 improving to 5.6 over a quarter is a better signal than a static 6.0. Look for directional movement, not a magic number.
Frequently asked questions
When should I use CES instead of NPS or CSAT?
Use CES when you want to measure the ease of a specific interaction (support resolution, onboarding, feature use). Use CSAT when you want to measure satisfaction with a specific experience. Use NPS when you want to measure overall loyalty and likelihood to recommend. Many teams use all three for different touchpoints. CES is most valuable for identifying friction points that drive churn.
What is a good CES score?
On a 7-point scale, 5.0 or above is good and 6.0 or above is excellent. More important than the absolute number is the trend — improving CES over time correlates with improving retention. Track CES by touchpoint to identify which interactions create the most friction.
How many responses do I need for a reliable CES score?
A minimum of 100 responses gives you a statistically meaningful average. For touchpoint-level analysis (CES for support vs. CES for onboarding), you need 100 responses per touchpoint. If you are just starting, focus on your highest-volume touchpoint first.
Should CES replace CSAT and NPS?
No. CES measures effort, CSAT measures satisfaction, and NPS measures loyalty. They are complementary, not competing. The strongest customer experience programs use CES for transactional interactions, CSAT for experience quality, and NPS for strategic direction. Start with CES if you suspect friction is your main retention problem.
How do I reduce CES without increasing support costs?
The most effective CES improvements actually reduce costs: better self-service content deflects tickets, first-contact resolution reduces repeat contacts, and proactive communication prevents issues from becoming support requests. Reducing effort for customers and reducing cost for the company are usually the same thing.
Authored by James Morton
Founder of Quackback. Building open-source feedback tools.
Try Quackback
The open-source feedback platform. Boards, voting, and roadmaps.
Get startedStar on GitHub132