Most teams track too many customer satisfaction metrics and act on almost none of them. Every listicle treats them as interchangeable, when the right metric depends on your stage and the decision you are trying to make.
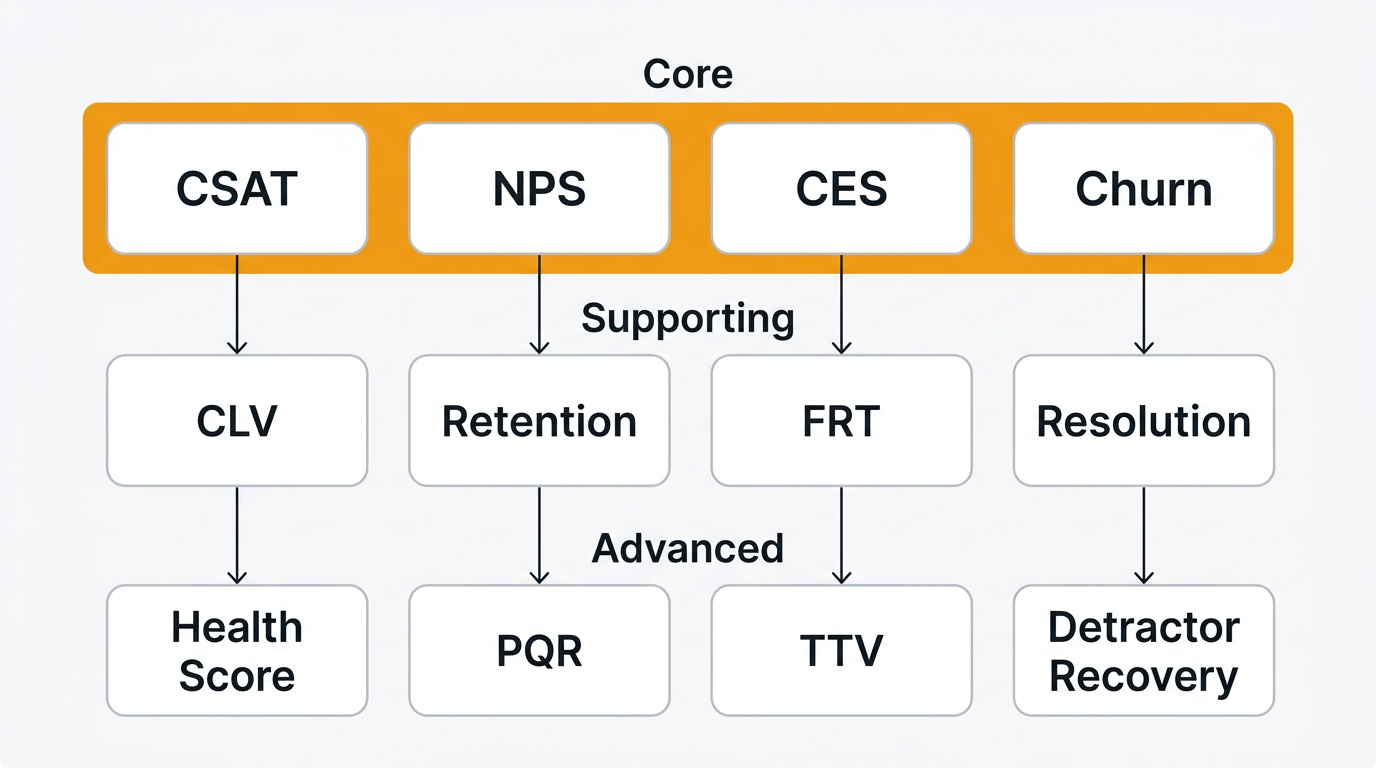
TLDR: Most teams track too many customer satisfaction metrics. The four that actually matter are CSAT, NPS, CES, and churn rate. Supporting metrics (CLV, retention, response time, resolution rate) and advanced metrics (health score, PQR, time-to-value, detractor recovery) come later, and only if they change a decision you would otherwise get wrong. This guide ranks 12 metrics by company stage, shows how to instrument each without tool sprawl, and identifies which ones to stop tracking.
The 4 metrics that actually matter
If you run a product with paying customers, you need exactly four numbers. Everything else is optional.
CSAT (Customer Satisfaction Score)
CSAT measures satisfaction with a specific interaction. Ask one question on a 1-to-5 scale: "How satisfied were you with this experience?" Count 4s and 5s as satisfied.
Formula: (satisfied responses / total responses) × 100
Start tracking CSAT as soon as you have ten paying customers. It tells you which touchpoint is broken right now. If CSAT on ticket resolution drops from 92% to 78% in a week, you have a support problem you can investigate the same afternoon.
The common mistake is averaging CSAT across every interaction type into a single top-line number. Segment by touchpoint or do not bother. Our CSAT calculator handles the math; see how to ask for customer feedback for timing.
NPS (Net Promoter Score)
NPS asks: "How likely are you to recommend us?" on a 0-10 scale. Promoters are 9-10, passives 7-8, detractors 0-6. The score is promoters minus detractors, from -100 to +100.
Formula: % promoters − % detractors
Start tracking NPS once you have 100 active customers. With fewer, the sample is noise. NPS is a trend metric, not a snapshot. An eight-point drop quarter over quarter means something shifted.
The common mistake is treating NPS as a universal health score. It correlates weakly with churn in self-serve and strongly in enterprise. Use it as one data point. Our NPS calculator and NPS survey template cover the mechanics.
CES (Customer Effort Score)
CES measures how much work a customer had to do. Ask: "How easy was it to [complete task]?" on a 1-to-7 scale, reverse-coded so higher is better.
Formula: sum of scores / number of responses
Start tracking CES when you have self-serve onboarding or a help center. It drives product and documentation decisions. If CES on "find the export feature" is 3.2, your navigation is broken.
CES is the best predictor of repeat purchase in research from CEB (now Gartner). The common mistake is asking CES after every interaction, which trains customers to ignore surveys. Ask on moments that matter: post-onboarding, post-resolution, post-upgrade. Full write-up in customer effort score.
Churn rate
Churn rate is the percentage of customers who leave in a given period. For subscription businesses, it is the only satisfaction metric that directly ties to revenue. If CSAT is up and churn is up, CSAT is lying.
Formula: (customers lost in period / customers at start of period) × 100
Track churn from day one. The decision churn drives is existential: is the business working. Everything else is diagnostic. The common mistake is tracking logo churn and ignoring revenue churn. A 2% logo churn sounds fine until your two largest accounts are in that 2%. Track both. Customer retention strategies covers what to do when churn climbs.
4 supporting metrics
These matter once you have a support team, a success team, or a finance team modeling the business. Before that, they are a distraction.
CLV (Customer Lifetime Value)
CLV estimates the total revenue you will earn from a customer. Simple version: average revenue per account times average lifespan in months.
Formula: ARPA × average lifespan (months)
Track CLV when you want to decide how much to spend on acquisition. If CLV is $2,400 and CAC is $800, you have a 3:1 ratio and room to push. The decision it drives is acquisition spend, not product. The common mistake is using CLV to justify every customer-facing hire. Treat it as a budget constraint, not a strategy.
Retention rate
Retention rate is the inverse of churn over a longer window, usually 12 months. It tells you what share of customers stick around.
Formula: ((customers at end − new customers) / customers at start) × 100
Start tracking retention once you have twelve months of data. Churn tells you how many are leaving now; retention tells you how durable the base is. Monthly churn can look great while 12-month retention is quietly collapsing. The common mistake is tracking retention without cohorting by signup month. Always cohort.
FRT (First Response Time)
FRT is how long a customer waits before a human replies to a ticket. Business hours only.
Formula: average time from ticket creation to first human response
FRT matters when support becomes a team, not a side job. The decision it drives is staffing. If FRT creeps from 45 minutes to 4 hours, you need another support person or better automation. The common mistake is optimizing FRT at the expense of resolution quality. A 30-second auto-reply that does not answer the question is worse than a two-hour reply that does.
Resolution rate
Resolution rate is the percentage of tickets closed without being reopened within 7 days. Reopens mean you did not actually solve the problem.
Formula: (tickets closed and not reopened / total tickets closed) × 100
Start tracking once you have ten support tickets a week. It is the cleanest signal for support quality and drives training decisions: which agents or ticket types have high reopen rates. The common mistake is measuring tickets closed without the reopen filter. That rewards speed at the expense of correctness.
4 advanced metrics
These are for teams past $5-10M ARR with a dedicated CS function. Adopting them too soon is how you end up with a 14-metric dashboard that nobody reads.
Health score
Health score is a composite 0-100 number blending product usage, support tickets, NPS, and billing status into a single account signal. There is no universal formula; you build one from your data.
It is worth the investment when you have a CS team prioritizing outreach across hundreds of accounts. It drives one decision: who does CS call this week. The common mistake is shipping a health score that nobody trusts. If your CSMs override the score every time, the model is wrong. Rebuild it with their input or delete it.
PQR (Product-Qualified Retention)
PQR is the retention rate of customers who have hit a defined activation event. It predicts long-term revenue better than raw retention because it filters out tire-kickers.
Formula: retention rate of customers who reached [activation event]
Track PQR when you have a self-serve motion and a clear activation event. If PQR is 90% but overall retention is 60%, your activation funnel is leaking. Fix onboarding, not retention. The common mistake is choosing an activation event that is too easy (logged in twice) instead of one that correlates with real use.
TTV (Time-to-Value)
TTV is the time from signup to the customer's first meaningful outcome. Not first login. First real outcome: first feedback collected, first roadmap published, first integration connected.
Formula: median days from signup to first value event
TTV matters when you want to improve trial-to-paid conversion. If median TTV is 11 days and you convert 18% of trials, shaving TTV to 3 days is probably worth more than a new pricing page. The common mistake is tracking mean instead of median. One power user who activates in an hour hides a long tail who never activate.
Detractor recovery rate
Detractor recovery rate is the percentage of NPS detractors who become passives or promoters in the next survey cycle after you follow up.
Formula: (detractors who improved score / detractors contacted) × 100
Track this when you have a success team with capacity for at-risk outreach. If recovery rate is 45%, keep doing it. If it is 8%, your follow-up playbook is broken. The common mistake is not measuring this at all and assuming outreach works. Half of detractor follow-up programs do nothing measurable.
How to choose by company stage
Most teams adopt metrics in the wrong order and end up with dashboards that look sophisticated and drive no decisions.
| Stage | Revenue | Metrics to track | Metrics to ignore |
|---|---|---|---|
| Pre-PMF | $0-$100k ARR | Churn, qualitative feedback, CSAT on key interactions | Everything else |
| Early traction | $100k-$1M ARR | Churn, CSAT, CES on onboarding, retention | NPS, health score, CLV |
| Growth | $1M-$10M ARR | Churn, CSAT, NPS, CES, retention (cohorted), FRT, resolution rate | Health score, PQR, detractor recovery |
| Scale | $10M+ ARR | All core + supporting + advanced as needed | None; be deliberate |
Pre-PMF, the only metric that matters is whether people stay or leave, and why. Be on a call with every churned customer. A voice of customer practice does more than any dashboard.
Early traction is when CSAT earns its place. Ignore NPS; your sample is too small to mean anything. Track CES on onboarding because activation is the biggest lever you have.
Growth stage is when NPS becomes meaningful and when customer feedback loops need real structure. You can also justify FRT and resolution rate because support is now a team.
Scale is when you earn the right to advanced metrics. The test is simple: if adopting a metric would not change a decision you are currently getting wrong, do not adopt it.
How to instrument each without tool sprawl
Most teams over-instrument. Every new metric becomes a new tool, a new integration, a new dashboard. Half get abandoned. Here is the opinionated minimum.
CSAT: Ask a single 1-5 question immediately after a ticket resolution or onboarding milestone. Inline in email or in-product. Do not send a separate survey email a day later; response rates collapse. A feedback widget embedded in your app captures CSAT at the moment of truth.
NPS: Quarterly, in-product, one question. Not monthly. Not via email blast. Rotate which segment sees it so you always have a fresh sample without fatiguing the base. A feedback platform with built-in NPS keeps the survey, responses, tags, and follow-up in one place.
CES: One question on the page where the effort happened. Post-onboarding, post-help-article, post-resolution. Same widget as CSAT; only the question and trigger change.
Churn: Your billing system is the source of truth. Do not calculate churn from product analytics or CRM data; it will be wrong. Pull cancelled subscriptions from Stripe or Chargebee and cohort by signup month.
CLV and retention: Same source, plus ARPA. A spreadsheet or basic BI query, not a new tool.
FRT and resolution rate: Your help desk (Zendesk, Freshdesk, Front, Help Scout) already tracks both. Turn on built-in reporting.
Health score, PQR, TTV, detractor recovery: You need a customer data warehouse and a BI tool by this point. If you do not have one, you are not ready for these metrics.
The rule: every metric should be collected by the tool that already owns that data surface. Surveys in a feedback tool. Billing in billing. Support in the help desk. See feedback analysis and the docs for wiring up Quackback.
Metrics to stop tracking
This is the section every other guide skips. You need to actively stop tracking the wrong metrics, because every vanity number in the dashboard costs weekly meeting time and gives the team permission to ignore the ones that matter.
Raw ticket volume. Total tickets per week tells you nothing. It conflates growth (more users, more tickets) with quality (broken product, more tickets). A flat ticket count during a growth phase is a win; a rising count during a flat phase is a disaster. Track tickets per 100 active users or drop it.
Positive sentiment percentage. Aggregate sentiment scores look impressive in a board deck and move almost never. A 2-point drop could mean one unhappy power user or a systemic issue; you cannot tell without reading the underlying feedback. Read the feedback. Skip the aggregate.
NPS without segmentation. A single company-wide NPS is the worst version of a useful metric. Enterprise and self-serve customers have different baselines. Averaging produces a number that describes no actual segment. Segment by plan, tenure, or use case, or stop reporting it.
Aggregate CSAT with multiple products. If you have two products or two personas, an aggregate CSAT is a lie. One product can be 95 and the other 72; you will see 83 on the dashboard and do nothing. Break it apart or delete it.
Survey response rate as a goal. Response rate is a diagnostic, not a target. Chasing it leads to badgering customers with repeat surveys, which poisons the data. Aim for signal, not volume. More in improve survey response rates.
Turning metrics into decisions
A metric that does not change behavior is a cost, not an asset. The framework is simple: every metric needs an owner, a threshold, and a trigger action.
Owner. One person. Not a team, not a committee, not "we". The owner explains why the number moved this week and what they are doing about it. If nobody owns a metric, it dies quietly in a dashboard.
Threshold. A specific line that triggers an action, not a direction. CSAT on ticket resolution below 85% triggers a review. NPS drop of more than 5 points quarter over quarter triggers a cohort analysis. CES above 4.5 on any touchpoint triggers a product conversation.
Trigger action. What happens when the threshold is crossed. Not "investigate". An actual workflow. Example: CES above 4.5 flags the top-3 friction points from tagged feedback and routes them to the roadmap within 2 weeks.
Without all three, you have a number. With all three, you have a system. A feedback platform helps with the last two: tagged feedback, trend tracking, and roadmap routing are the infrastructure that turns metric movement into product decisions.
Tooling: what a feedback platform handles vs. what you still need
Here is the honest breakdown.
A feedback platform like Quackback handles:
- NPS, CSAT, and CES surveys (widget-based and email)
- Response collection, tagging, and trend tracking
- Sentiment analysis on free-text responses
- Feedback-to-roadmap linking so detractor responses influence what you build
- Integrations with support and product tools
- An MCP server if you want your AI setup to query customer feedback directly
Quackback is open source under AGPL-3.0 and self-hosted, with AI analysis included. That covers roughly 60% of the customer satisfaction stack for a team under $10M ARR.
What you still need:
- Product analytics: Mixpanel, Amplitude, PostHog. Feedback tools do not track event streams, funnels, or feature adoption.
- Billing and revenue metrics: Stripe or Chargebee. Churn, revenue retention, and CLV live here.
- Support metrics: Zendesk, Freshdesk, Front, or Help Scout. FRT and resolution rate are native to the help desk.
- BI layer: Once at scale, a warehouse and a BI tool (Metabase, Looker, Hex) are how advanced metrics get calculated.
The trap is buying a single tool that claims to do all of the above. It will do each job badly. Pick one tool per data surface and keep the stack small. For a deeper comparison, see best customer feedback tools 2026 and collect customer feedback.
Frequently asked questions
What is the most important customer satisfaction metric?
Churn rate. Everything else is diagnostic; churn is the only metric that directly tells you whether the business is working. If churn is healthy, most other metrics will be healthy too, and if churn is bad, no CSAT number will save you. Track churn from day one and treat it as the primary signal.
How often should I survey customers for CSAT?
Ask CSAT immediately after a specific interaction, not on a schedule. A support ticket resolution, an onboarding call, a billing change. Never send a standalone "how are we doing" CSAT email. Response rates will be low and the data will be biased toward complainers and superfans.
What is a good NPS score?
Above 30 is good for SaaS, above 50 is excellent, above 70 is world-class and usually suspicious. The more useful question is whether your NPS is trending up or down quarter over quarter, segmented by customer type. An absolute NPS number without a trend or a segment tells you almost nothing.
Should a startup track NPS before product-market fit?
No. You do not have enough customers for the sample to be meaningful, and the time you spend running NPS surveys is time you should spend talking directly to every user. Pre-PMF, do qualitative interviews and track churn. NPS earns a place on your dashboard once you pass 100 active customers.
How do you measure customer effort score?
Ask one question in context: "How easy was it to [complete task]?" on a 1-7 scale, where higher means easier. Ask it at the moment the effort happened, not later. Post-onboarding, post-help-article, post-resolution. Average the numeric responses and tag the free-text ones. See the full writeup in customer effort score.
What is the difference between CSAT, NPS, and CES?
CSAT measures satisfaction with a specific interaction. NPS measures overall relationship strength and loyalty. CES measures the effort a customer had to put in to get something done. They answer different questions and should be used together, not as substitutes. CSAT is tactical, NPS is strategic, CES is operational.
Authored by James Morton
Founder of Quackback. Building open-source feedback tools.
Try Quackback
The open-source feedback platform. Boards, voting, and roadmaps.
Get startedStar on GitHub132