
Not every team needs a dedicated roadmap tool. If you're early-stage, running a small product, or just getting started with structured planning, a spreadsheet is often enough. It's free, everyone already knows how to use it, and it requires no onboarding.
This post gives you a free product roadmap template for Google Sheets that you can recreate in minutes. It also covers how to set it up, how to maintain it, and when you have outgrown it.
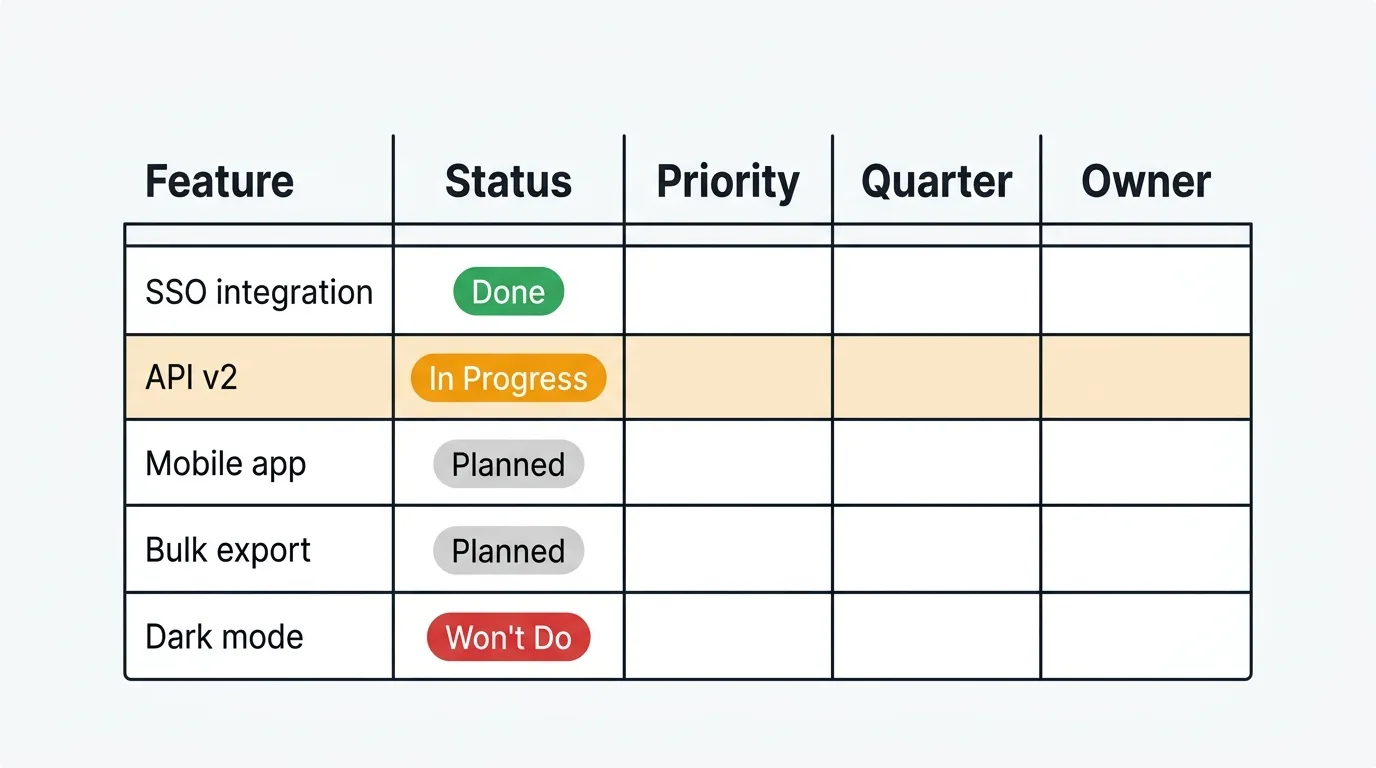
A product roadmap template for Google Sheets is a single spreadsheet with one row per feature and columns for Feature, Description, Status, Priority, Quarter, Owner, Category, Feedback count, and Notes. Copy the column structure below into a new sheet, add conditional formatting to the Status column, and share it with your team. It is free, needs no onboarding, and works well for early-stage products until your team, backlog, or stakeholder count grows.
Why use Google Sheets for your roadmap
Google Sheets has a few real advantages over dedicated roadmap software, especially early on.
It costs nothing. You don't need to evaluate vendors, negotiate contracts, or convince finance to approve a new tool. If your team uses Google Workspace, Sheets is already there.
Everyone knows how to use it. You won't spend time training stakeholders or waiting for people to figure out a new interface. Filtering, sorting, conditional formatting — these are skills most people already have.
Sharing is straightforward. You can share a link with view or comment access. Stakeholders can see the roadmap without creating an account. External collaborators can leave comments without being added to your workspace.
For early-stage teams or small products with a short backlog, Sheets handles the job. The limitations only start to show when your team, your backlog, or your stakeholder count grows significantly.
What's in the template
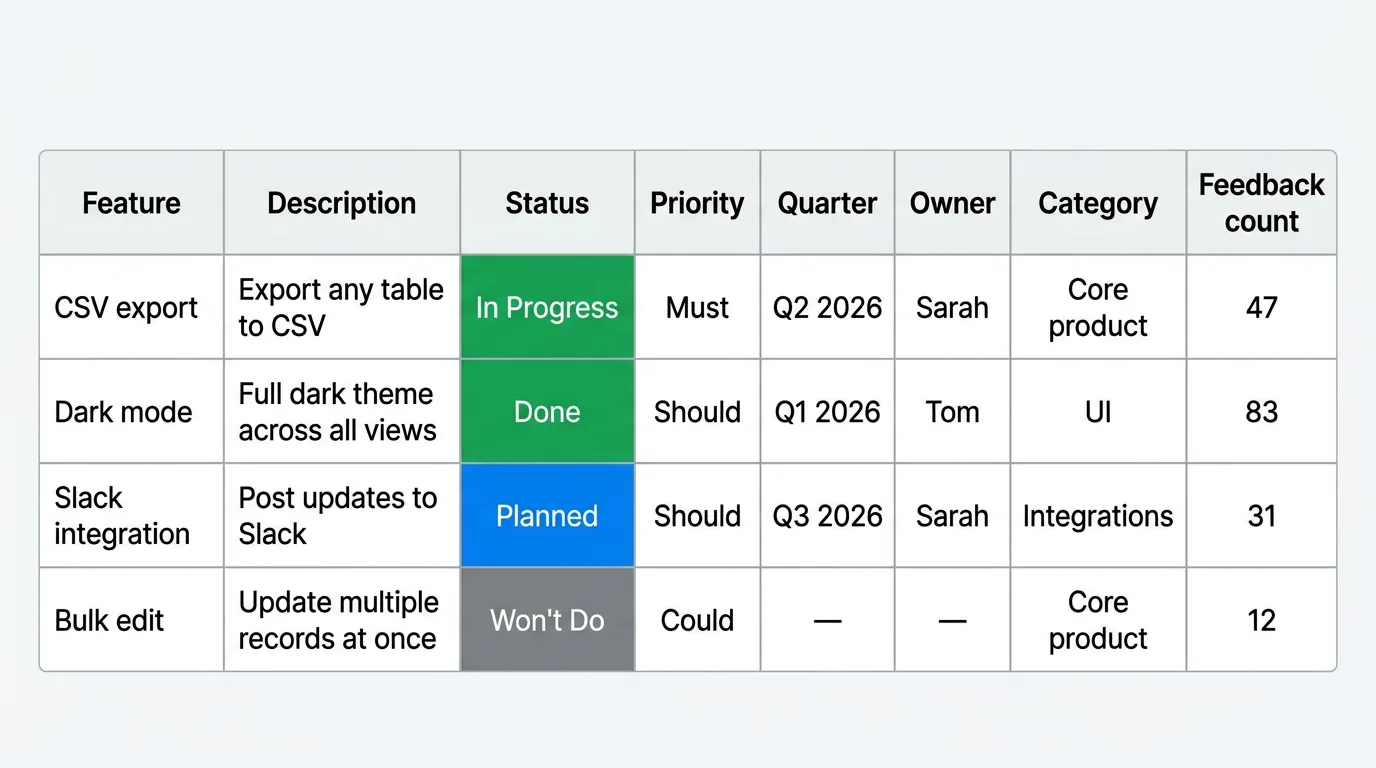
The template is a single sheet with one row per item and the following columns:
| Feature | Description | Status | Priority | Quarter | Owner | Category | Feedback count | Notes |
|---|---|---|---|---|---|---|---|---|
| CSV export | Export any table to CSV with one click | Planned | Must | Q2 2026 | Sarah | Core product | 47 | Needed for enterprise tier |
| Dark mode | Full dark theme across all views | In Progress | Should | Q1 2026 | Tom | UI | 83 | Design complete, in dev |
| Slack integration | Post status updates to a Slack channel | Planned | Should | Q3 2026 | Sarah | Integrations | 31 | Waiting on API docs |
| Bulk edit | Select and update multiple records at once | Won't Do | Could | — | — | Core product | 12 | Revisit in H2 |
| Onboarding checklist | Interactive checklist for new users | Done | Must | Q4 2025 | James | Growth | 19 | Shipped Nov 2025 |
| API rate limit dashboard | Show usage and limits in account settings | Planned | Could | Q3 2026 | Tom | Developer | 8 | Low priority for now |
The Status column uses four values: Planned, In Progress, Done, Won't Do. These map to the actual lifecycle of a feature without introducing ambiguity.
The Priority column follows MoSCoW notation — Must, Should, Could, Won't. If you're not familiar with the framework, the MoSCoW guide covers how to apply it to feature planning.
The Feedback count column is worth including even if it starts at zero. It forces you to connect roadmap items to actual user demand rather than internal assumptions. As you collect feedback, update this number. It becomes a fast signal for which items deserve more attention.
How to set it up
Step 1: Duplicate the template. Open the template, go to File > Make a copy, and save it to your own Drive. Rename it something like "[Product] Roadmap — 2026."
Step 2: Customize the columns. Delete any columns you don't need. If you don't have owners yet, remove that column. If you track work in sprints rather than quarters, replace the Quarter column with a Sprint column. The goal is a structure that reflects how your team actually works, not an idealized version.
Step 3: Add conditional formatting for Status. Select the Status column, go to Format > Conditional formatting, and assign colors to each value. A common scheme: green for Done, yellow for In Progress, blue for Planned, gray for Won't Do. This makes the sheet scannable at a glance without having to read every cell.
Step 4: Share with your team. Use the Share button to give your team edit access and stakeholders view or comment access. If you want a version stakeholders can reference without accidentally editing it, publish it as a web page via File > Share > Publish to web.
Step 5: Set a weekly update cadence. Block 15 minutes each week to update statuses, add new items, and archive completed work. A roadmap that isn't updated becomes noise. The cadence doesn't need to be long — it just needs to be consistent.
Tips for maintaining it
Update it weekly. Stale roadmaps breed distrust. If stakeholders check the sheet and find items that shipped three weeks ago still marked "In Progress," they stop relying on it. Fifteen minutes on a Monday morning is enough to keep it accurate.
Archive shipped items. When features are done, move them to a second sheet called "Archive" rather than deleting them. This preserves your history without cluttering the main view. You can always filter the main sheet to hide Done items, but having a clean archive is useful for planning retrospectives and tracking velocity over time.
Link to feedback sources. Use the Notes column to link to feedback threads, support tickets, or user interviews that motivated each item. When someone asks "why is this on the roadmap," you want to point to evidence, not recall it from memory.
Keep it under 50 items. A roadmap with 200 rows is a backlog, not a roadmap. If your sheet grows past 50 active items, prune it. Move low-priority items with no near-term plan to the archive. Mark speculative items as Won't Do. A shorter roadmap forces clearer decisions about what actually matters now.
When to upgrade to a dedicated tool
Google Sheets works until it doesn't. Here are the signs it's no longer enough.
Multiple stakeholders are editing simultaneously. Sheets handles concurrent editing poorly for structured data. When three people update the same rows during a planning meeting, you end up with conflicts, accidental overwrites, and no audit trail.
You need a customer-facing roadmap. A shared Google Sheet is not a good public roadmap. It exposes your internal notes, lacks the structure customers expect, and gives you no control over what gets shown. For a customer-facing roadmap, you need a dedicated tool — see the best public roadmap tools for options.
You want to connect feedback directly to roadmap items. In Sheets, the "Feedback count" column is a number you update manually. It has no connection to actual feedback data. When you want votes, comments, and feature requests to automatically inform your roadmap, a spreadsheet becomes a bottleneck.
You need automated notifications. Sheets has no way to notify users when an item's status changes. If you're managing customer expectations around specific features, you need tooling that can communicate updates automatically.
You're managing more than 100 active items. At that scale, the filtering and sorting capabilities of Sheets start to feel limiting. You need tagging, saved views, and smarter filtering to keep the signal clear.
When you hit those limits, Quackback's roadmap feature is worth looking at. It connects directly to your feedback board, so vote counts and user comments surface alongside roadmap items without manual updates. You can publish a customer-facing roadmap that users can view and interact with, and they get notified when the status of items they care about changes.
Quackback is open source (AGPL-3.0) with a managed cloud option. Built-in AI triage and an MCP server let you query feedback and roadmap data from your own tools. If you would rather not run it yourself, the pricing page covers the cloud tiers.
For more context on what to look for in a roadmap tool, see product roadmap examples, the agile roadmap guide, and the Quackback docs. If you are weighing dedicated tools, compare Quackback vs Productboard and Quackback vs Canny.
Try Quackback — open source with a managed cloud option. Start free. Get started | View on GitHub
Frequently asked questions
Is a Google Sheets roadmap good enough for a real product?
For early-stage products and small teams, yes. A Google Sheets roadmap works well when your backlog is short, your team is small, and your planning process is still evolving. Spreadsheets stop scaling once your stakeholders, items, or feedback sources grow, but until then a maintained sheet does the job.
How is a roadmap different from a backlog?
A backlog is a full list of everything you might build, organized for engineering to pull from. A roadmap is a strategic view of what you plan to build, why, and roughly when. Roadmaps are shorter, higher-level, and time-bound. A list of 200 items is a backlog.
How often should I update a Google Sheets roadmap?
Once a week is usually enough. Updating status more often makes the sheet feel unstable, since stakeholders cannot track daily shifts. A Monday morning pass over all active items is a good habit. When something significant changes mid-week, update it then and tell your team directly.

Authored by James Morton
Founder of Quackback. Building open-source feedback tools.
Try Quackback
The open-source feedback platform. Boards, voting, and roadmaps.
Get startedStar on GitHub305