Every product team starts the same way. Someone creates a spreadsheet, names it "Feature Requests," and shares it with the team. It works. For a while.
Spreadsheets are familiar, free, and infinitely flexible. There is no approval process to adopt one, no vendor evaluation, no integration work. You open a new sheet, add some columns, and start tracking. For early-stage products with a small user base and a small team, this is genuinely the right tool.
The problem is not that spreadsheets are bad at tracking feature requests. The problem is that they stop working at a specific scale, and most teams do not recognize the signs until they have already lost signal in the noise.
This guide gives you a spreadsheet template that actually works, the specific signals that tell you it is time to switch, and what to look for when you do.
A feature request spreadsheet template that works
Most feature request spreadsheets fail because they are either too simple (a list of ideas with no structure) or too complex (20 columns that nobody fills out). Here is a template that balances structure with usability.
Core columns
| Column | Type | Purpose |
|---|---|---|
| Request | Text | One-sentence description of the feature request |
| Requester | Text | Who asked for it (name, company, or email) |
| Source | Dropdown | Where it came from (support ticket, sales call, Slack, email, interview) |
| Category | Dropdown | Product area (onboarding, reporting, integrations, billing, etc.) |
| Status | Dropdown | Current state (New, Under Review, Planned, In Progress, Shipped, Declined) |
| Priority | Dropdown | How important (P0 Critical, P1 High, P2 Medium, P3 Low) |
| Votes | Number | How many users have asked for the same thing |
| Date added | Date | When the request was first logged |
| Notes | Text | Additional context, links to conversations, or reasons for decisions |
How to use it
One row per unique request. When multiple users ask for the same thing, increment the Votes column and add their name to the Requester field. Do not create a new row for each duplicate — that defeats the purpose of tracking demand.
Use dropdowns for Status, Priority, Source, and Category. Free-text fields in these columns guarantee inconsistency. Someone will write "high" while someone else writes "High" while a third person writes "important." Dropdowns enforce consistency without extra effort.
Update Status when things change. A spreadsheet only works if it reflects reality. When you start working on a request, move it to In Progress. When you ship it, move it to Shipped. When you decide not to build something, move it to Declined and add a note explaining why. Stale statuses are the fastest way to make a spreadsheet useless.
Review weekly. Set a recurring 30-minute meeting to review new requests, update priorities, and clean up duplicates. Without this, the spreadsheet drifts out of date within two weeks.
Google Sheets formula tips
Auto-sort by votes: Use a filtered view sorted by the Votes column descending. Your highest-demand requests stay at the top.
Conditional formatting: Color-code the Status column. Green for Shipped, blue for In Progress, yellow for Planned, red for Declined. Visual cues make scanning faster than reading text.
COUNTIF for category breakdown: =COUNTIF(D:D, "Integrations") gives you a count of requests per category. Useful for spotting which product areas generate the most demand.
Data validation for dropdowns: Select the column, go to Data > Data Validation, and enter your allowed values. This prevents free-text entries in columns that should be structured.
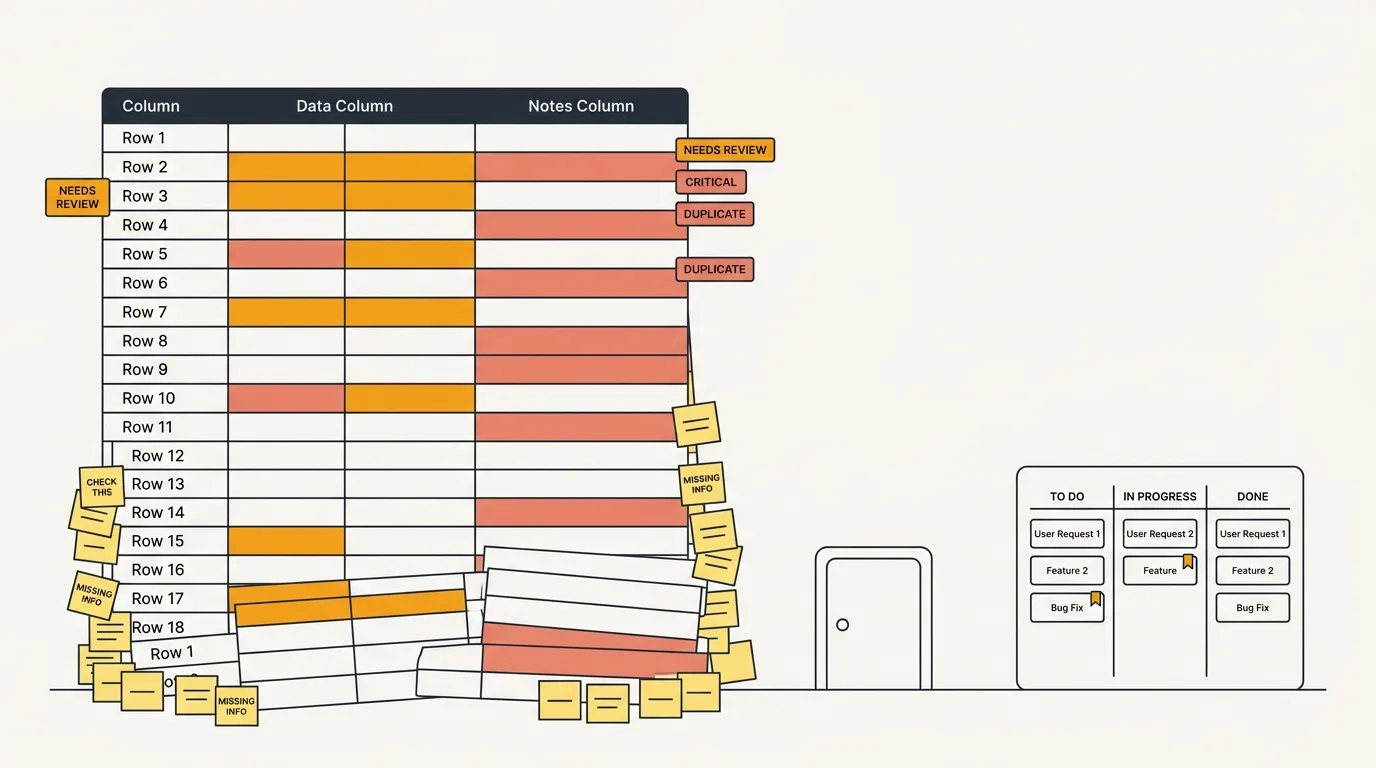
Where spreadsheets break down
A spreadsheet works until it does not. These are the specific failure modes.
No deduplication
User A emails "we need a Slack integration." User B mentions it in a support ticket. User C brings it up in a sales call. Three team members log it as three separate rows. Without a system that surfaces existing requests when someone adds a new one, duplicates multiply.
At 50 requests, you can eyeball duplicates. At 200, you cannot. At 500, your spreadsheet has become a list of requests where half of them are duplicates of the other half, and your vote counts are meaningless because demand is fragmented across multiple rows.
No user-facing portal
Your spreadsheet is internal. Users cannot see it, search it, or vote on existing requests. Every feature request requires a user to contact you through some other channel (email, support ticket, Slack) and a team member to manually log it.
This means you only hear from users who care enough to reach out. The silent majority — users who would vote on an existing request if they could see it, but will not take the initiative to email you — never appears in your data.
A public feedback board with voting flips this dynamic. Users browse existing requests, vote on what matters to them, and submit new ideas if theirs is not already listed. You hear from a much larger percentage of your user base.
No notifications
When you ship a feature that users requested, how do you tell them? In a spreadsheet, you have a list of requester names or emails. You could email them manually. In practice, nobody does this consistently. The feedback loop breaks — users do not know their request was heard, so they stop making requests.
Formula and data errors
Spreadsheets are deceptively fragile. Research by Ray Panko at the University of Hawaii found that 88% of spreadsheets contain errors. A 2024 follow-up study put the figure at 94% for business-critical spreadsheets. One wrong cell reference in your RICE scoring formula silently corrupts every priority ranking in the sheet, and nobody notices until someone asks why a low-value feature got built first.
Multi-editor conflicts
Google Sheets handles simultaneous editing reasonably well, but it does not handle simultaneous decision-making. When two PMs review the same spreadsheet and update priorities based on different conversations, you get conflicting assessments with no audit trail of who changed what or why.
No segmentation
A spreadsheet treats every row equally. But a request from your largest enterprise customer should probably carry more weight than a request from a free trial user who signed up yesterday. Without integration to your CRM or billing system, you cannot segment requests by customer value, plan tier, or usage level.
Reporting is manual
Want to know how many requests you received this quarter versus last quarter? How many shipped? What percentage were declined? You can build these reports with pivot tables and formulas, but it takes time and breaks whenever someone changes the sheet structure. A dedicated tool generates these reports automatically.
Signs it is time to upgrade
Not every team needs to upgrade. If you have fewer than 100 feature requests total and a team of five or fewer, a spreadsheet is probably fine. But watch for these signals:
You are spending more than 30 minutes per week on spreadsheet maintenance. Deduplicating, updating statuses, reconciling conflicting edits, and building reports. When maintenance time exceeds the value of the data, the tool is working against you.
Users ask about the status of their request and you cannot find it. If searching your own spreadsheet takes more than 30 seconds, it has grown past the point of usability.
You have no idea how many people want a specific feature. Because demand is fragmented across duplicate rows, partial entries, and notes buried in the Notes column. Your vote counts do not reflect reality.
Your team has stopped logging requests. The friction of opening the spreadsheet, checking for duplicates, and adding a row is high enough that people skip it. When requests go unlogged, your data becomes incomplete and your prioritization decisions are based on partial information.
Customers tell you they submitted feedback and nothing happened. The feedback loop is broken. Requests go in but acknowledgement never comes out.
You need to present feedback data to leadership. Showing a messy spreadsheet to your VP of Product is not the same as showing a dashboard with vote counts, trend lines, and status breakdowns. If you need to report on feedback, you need a tool that makes reporting easy.
What to look for in a dedicated tool
When you outgrow a spreadsheet, you do not need the most feature-rich tool on the market. You need a tool that solves the specific problems your spreadsheet cannot handle.
Deduplication. The tool should surface similar existing requests when someone submits a new one. AI-powered duplicate detection is even better — it catches semantic duplicates that keyword matching misses ("Slack integration" and "connect with Slack" are the same request). AI-powered feedback tools handle this automatically.
Public voting. A user-facing portal where customers can see existing requests, vote, and submit new ones. This is the single biggest upgrade over a spreadsheet — it turns feedback collection from a manual internal process into a self-service external one.
Status updates and notifications. When you change a request's status, users who voted on it should be notified automatically. This closes the feedback loop without manual effort.
Integrations. Your feedback tool should connect to the tools your team already uses: Slack for incoming feedback, Jira or Linear for issue tracking, and your product for an embedded widget.
Data import. You have an existing spreadsheet full of feature requests. Your new tool should let you import that data so you do not start from zero. Most tools accept CSV imports. Some offer dedicated migration tools for specific platforms.
If you want to avoid vendor lock-in and keep costs predictable, open-source feedback tools are worth considering. They are free to self-host, and your data stays on your infrastructure.
Frequently asked questions
Is a spreadsheet ever the right choice for feature request tracking?
Yes, for early-stage products with fewer than 100 requests and a team of five or fewer. At that scale, the simplicity and flexibility of a spreadsheet outweigh its limitations. The key is recognizing when you have outgrown it and switching before your data quality degrades.
How do I migrate from a spreadsheet to a dedicated tool?
Export your spreadsheet as a CSV. Most feedback tools accept CSV imports that map your columns to their data model. Clean up your data first: merge duplicate rows, standardize status values, and remove incomplete entries. The migration itself takes less than an hour for most datasets.
Should I use Google Sheets or Excel?
Google Sheets for team collaboration (real-time editing, sharing, no file syncing). Excel for complex analysis (better pivot tables, more formula power, works offline). For feature request tracking specifically, Google Sheets is usually the better choice because multiple team members need to add and update requests.
How do I track votes in a spreadsheet?
Use a Votes column with a number. When a new user requests something that already has a row, increment the number and add the requester's name to a comma-separated list in the Requester field. This is manual and error-prone — it is one of the first things that breaks at scale, because team members forget to check for existing rows before adding new ones.
What is the best free alternative to a spreadsheet for feature tracking?
Quackback is open source and free to self-host. It replaces the spreadsheet with a feedback board that has public voting, automatic deduplication, status notifications, and a widget you can embed in your product. If you want the structure of a dedicated tool without a monthly bill, self-hosting an open-source option is the most direct upgrade path.
Authored by James Morton
Founder of Quackback. Building open-source feedback tools.
Try Quackback
The open-source feedback platform. Boards, voting, and roadmaps.
Get startedStar on GitHub132