Most startups guess at product-market fit. They look at retention curves, revenue growth, or how often users come back. Those signals matter, but they are lagging indicators. By the time your retention curve tells you something is wrong, you have already lost the users who could have told you why.
There is a survey that measures PMF directly. It asks one question, it has a clear benchmark, and it takes less than a day to set up.
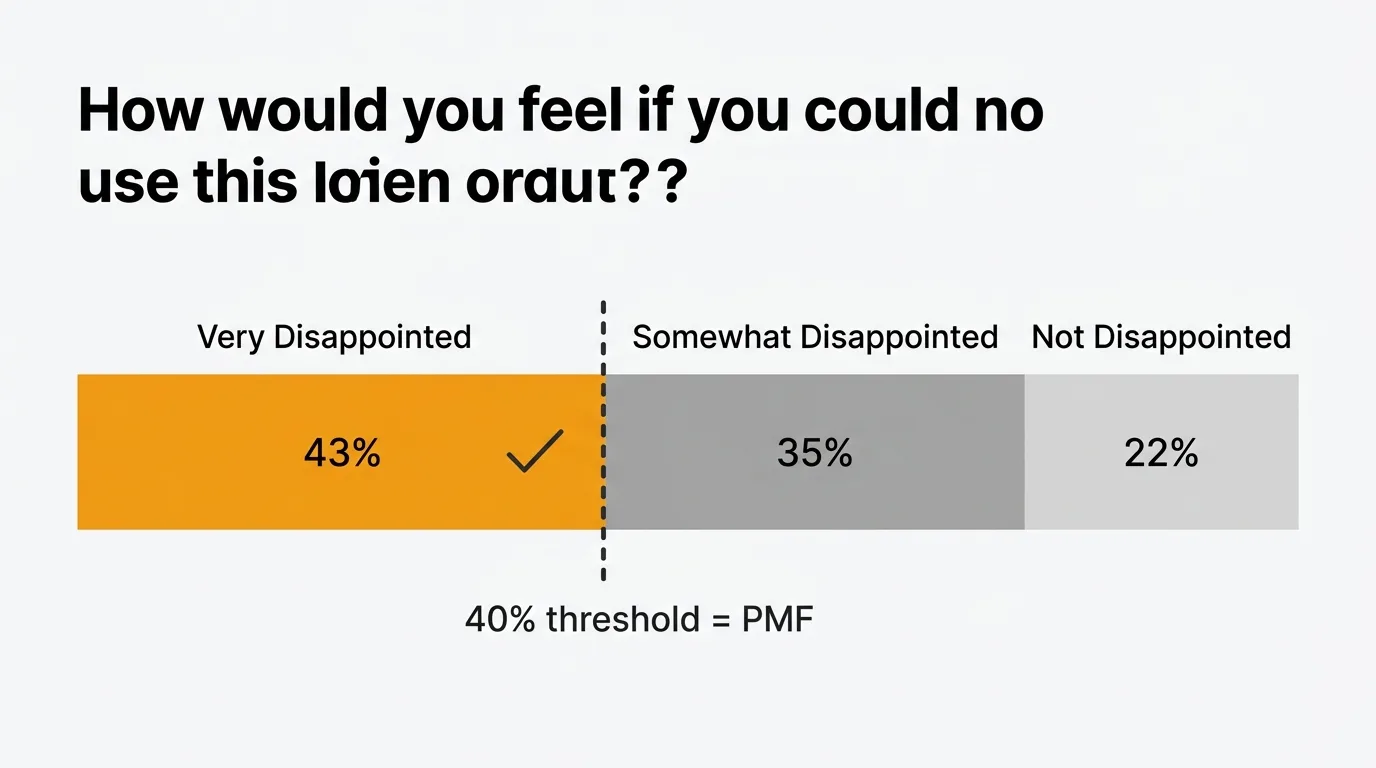
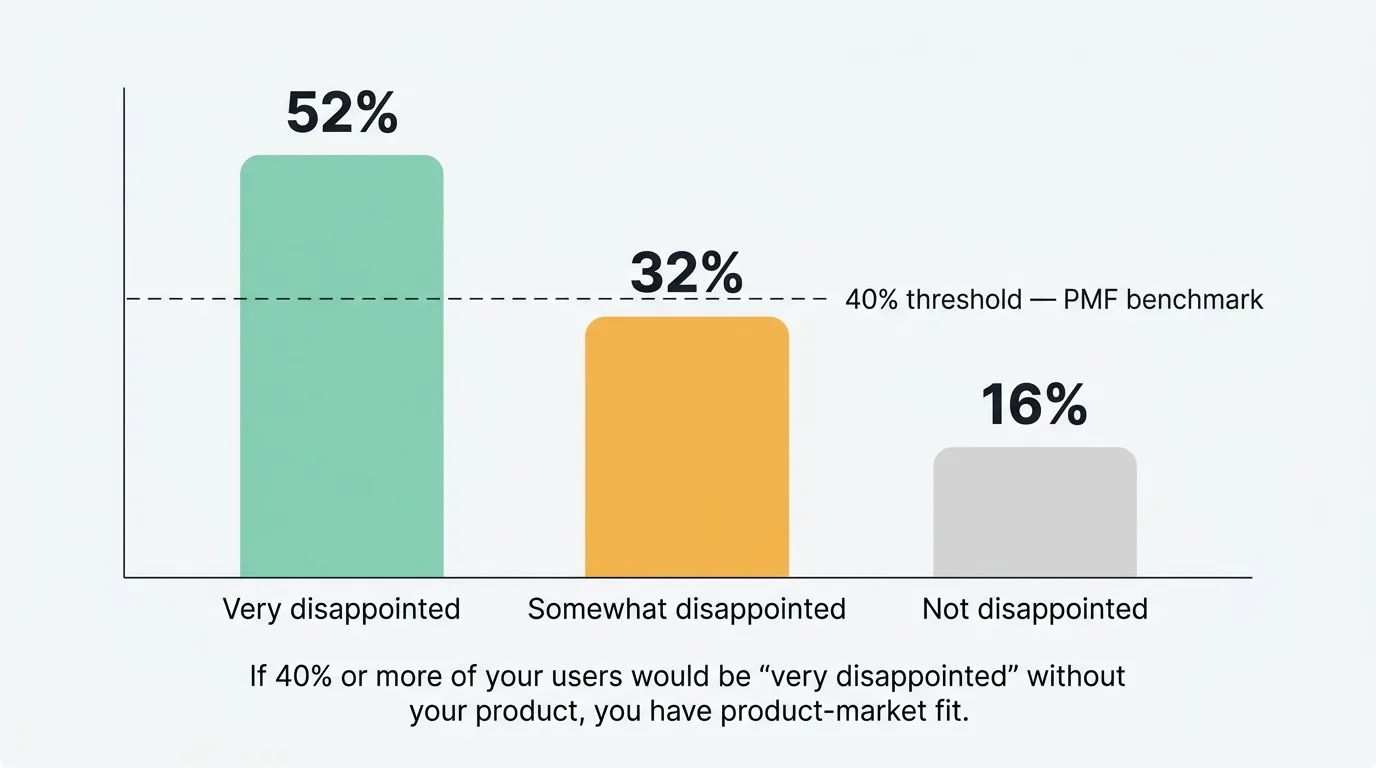
The method comes from Sean Ellis, who coined the term "growth hacker" and ran growth at Dropbox, Eventbrite, and LogMeIn. After surveying hundreds of startups, he found a consistent pattern: companies that had achieved PMF shared one trait. At least 40% of their users said they would be "very disappointed" if they could no longer use the product. Companies below that threshold consistently struggled to grow.
A product-market fit survey asks users one diagnostic question — "How would you feel if you could no longer use [Product]?" — with four answer options. Your PMF score is the percentage who answer "Very disappointed." The 40% rule, from the Sean Ellis test, says that 40% or higher signals product-market fit, and below 40% means you do not have it yet.
What is a product-market fit survey
The PMF survey is a short questionnaire built around a single diagnostic question. Unlike NPS, which measures loyalty, the PMF survey measures dependency. It asks users to imagine the product disappearing and report how that would feel.
The core insight is that users who would be "very disappointed" to lose a product are not just satisfied — they have integrated it into how they work. They have formed a habit. That is what PMF looks like at the user level. When enough of your users feel that way, you have something worth growing.
The survey is typically short: one core question, a handful of follow-ups, and nothing else. The goal is signal, not comprehensiveness.
The core PMF question
The exact wording matters. Do not paraphrase it.
"How would you feel if you could no longer use [Product]?"
Response options:
- Very disappointed
- Somewhat disappointed
- Not disappointed
- N/A — I no longer use [Product]
Your PMF score is the percentage of respondents who select "Very disappointed." If that number is 40% or above, you have PMF. Below 40%, you do not — at least not yet.
The "N/A" option is important. Users who have already churned skew your results downward. Their answers reflect a product they have already decided to stop using, which is useful information but not what this question is designed to capture. Filter them out when calculating your score.
Calculate your score like this: divide the number of "Very disappointed" responses by the total number of responses minus the "N/A" responses. Multiply by 100.
For example: 60 "Very disappointed" responses out of 130 total, with 10 "N/A" responses. Your score is 60 / (130 - 10) = 50%.
Follow-up questions
The follow-up questions are where you get the information you need to act. The core question tells you your score. The follow-ups tell you what to do with it.
What is the main benefit you get from [Product]?
This surfaces how users actually perceive your value proposition, which is often different from how you describe it. The language users use to describe the main benefit is the language you should use in your marketing. It also tells you what you cannot afford to break.
What type of person do you think would benefit most from [Product]?
Ask users to describe your ideal customer. They know your product better than most prospects do, and their answers often reveal segments you have not fully considered. This is particularly useful if your score is high but varies across cohorts.
How could we improve [Product] to better meet your needs?
Open-ended. Let users write freely. The "very disappointed" group will give you ideas for strengthening an already strong product. The "somewhat disappointed" group — which is your most important cohort — will tell you exactly what is holding them back from full commitment.
What would you use as an alternative if [Product] were no longer available?
This reveals your real competitors, not the ones you think you have. Users may name a direct competitor, a workaround, a spreadsheet, or nothing at all. "Nothing" is a strong signal. "Spreadsheets" tells you the category is still being educated. A named competitor tells you where your differentiation needs to sharpen.
How did you discover [Product]?
Useful for attributing growth channels. If your highest-PMF users come from a specific channel or referral source, that channel is worth investing in. If they come from organic word-of-mouth, that is a signal PMF is already doing some of the growth work for you.
Would you be willing to share more about your experience in a short call?
Include a yes/no field with space for contact details. Users from the "very disappointed" segment who agree to a call are your best research subjects. Users from the "somewhat disappointed" segment who agree are your most valuable source of improvement ideas.
PMF survey template
Here is a complete, copy-pasteable template.
-
How would you feel if you could no longer use [Product]?
- Very disappointed
- Somewhat disappointed
- Not disappointed
- N/A — I no longer use [Product]
-
What is the main benefit you get from [Product]? (Open text)
-
What type of person do you think would benefit most from [Product]? (Open text)
-
How could we improve [Product] to better meet your needs? (Open text)
-
What would you use as an alternative if [Product] were no longer available? (Open text)
-
How did you first discover [Product]? (Open text)
-
Would you be willing to share more in a short 15-minute call?
- Yes — my email is: (text field)
- No
Keep this order. The core question first. Open-ended improvement questions in the middle. The call request last. Respondents who make it to question 7 are already engaged — that is the right moment to ask for more.
How to distribute your survey
Who to send it to. Target users who have experienced your core value proposition. That means users who have completed onboarding, used the product at least once in the past two weeks, and been active for at least a week or two. Brand-new users have not formed a real opinion yet. Churned users will give you useful churn data, but they will drag your PMF score down and obscure the signal from active users.
When to send it. Timing matters more than most teams expect. Too early and users have not formed a meaningful attachment. Too late and the users who churned — often the ones most disappointed — are already gone. For most SaaS products, 2-4 weeks after a user reaches a key activation milestone is the right window. That is when the habit is either forming or failing to form.
How many responses you need. Aim for a minimum of 40-50 responses before drawing conclusions. Below that, the math is fragile: at 50 responses, a single answer shifts your score by roughly 2 percentage points, so small samples move on noise. 100+ responses gives you a much more reliable reading, and it lets you segment the results meaningfully. If your user base is small, extend the collection window rather than reducing the threshold.
Where to send it. Email is the most reliable distribution channel for this survey. Send it from a named person — a founder or a product manager — not a generic address. A personal subject line like "Quick question about [Product]" consistently outperforms anything that sounds like a marketing blast. For products with strong in-app engagement, an in-app widget that triggers after a key action is an effective complement to email. In-app delivery captures users who are actively using the product and avoids the inbox entirely.
How often to run it. The PMF survey is a diagnostic, not a continuous tracking tool. Run it when you have made significant product changes, when you are trying to understand a new segment, or when you are preparing for a fundraise. Quarterly is reasonable for early-stage companies. Running it too frequently creates survey fatigue and produces results that are hard to compare across periods.
How to analyze results
Calculate the 40% benchmark. Start here. Filter out "N/A" responses and calculate the percentage of remaining respondents who selected "Very disappointed." That is your score. Write it down before going further.
Segment by cohort. A single aggregate score hides important variation. Break your results down by: plan type (free vs. paid), user tenure (less than 30 days vs. more than 90 days), acquisition channel, and company size if you serve multiple market segments. You may find that PMF is strong among one segment and weak among another. That is not a failure — it tells you exactly where to focus.
Read every open-ended response. Do not summarize them with a word cloud or a spreadsheet formula. Read them. The "somewhat disappointed" responses are the most important. These users see value in your product but have not committed fully. Their suggestions tend to be specific and actionable. Group them by theme. The themes that appear most often across the "somewhat disappointed" group are your clearest product priorities.
This is where a dedicated feedback system earns its place. Routing PMF responses into one inbox lets you tag and theme them in context instead of in a spreadsheet, and connect each theme to your roadmap. Quackback is open source, so you can route an entire user base through it. Its AI clustering groups similar open-ended answers, and the MCP server lets you query the themes from your own tools.
Compare "very disappointed" and "somewhat disappointed" language. Look at how each group describes the main benefit. If there is a gap — if the "very disappointed" group uses specific, functional language and the "somewhat disappointed" group uses vague language — that gap often reveals an onboarding or activation problem. Users who get to the core value are loyal. Users who never fully get there are not.
Tag the alternative tools mentioned. Build a frequency table of alternatives cited. The most common alternatives define your competitive landscape from the user's perspective. If a tool you did not consider a competitor appears repeatedly, that is worth investigating.
What to do with your results
If your score is below 40%. Do not panic and do not ignore it. Focus on the "somewhat disappointed" group — they are your most valuable resource. They see enough value to use your product but not enough to depend on it. Read every open-ended response from this group. Find the one or two themes that appear most consistently. Those themes are your near-term product priorities.
Do not try to convert "not disappointed" users. They are the wrong segment, the wrong use case, or both. Doubling down on users who do not find your product essential is how you end up with a product that is vaguely useful to everyone and essential to no one.
Also look at the "very disappointed" minority you do have. Even if they are only 20% of your respondents, they are telling you something works. Figure out what distinguishes them. What did they use the product for? How did they find it? What do they describe as the main benefit? That profile is your target customer.
If your score is above 40%. Shift your focus to growth. You have evidence that a meaningful portion of your users depend on your product. The priority now is getting more of the right users to that point of dependency. Use the "very disappointed" responses to sharpen your positioning — the language they use to describe the main benefit is often better marketing copy than anything your team will write. Use the alternative tools they mention to inform your competitive differentiation.
Continue to track the score over time. A score above 40% today can slip below it if you change your acquisition channels, expand to a new segment, or make significant product changes. Re-run the survey after major changes to verify you have not moved the product away from what made it essential.
Close the loop. Reply to users who left contact details and agreed to a call. Schedule those calls. Users who take time to fill out a survey and offer to talk further are your best research subjects. Treat that offer as a priority, not a nice-to-have.
PMF survey vs NPS
These tools measure different things and serve different purposes.
The PMF survey is a diagnostic. You run it to determine whether you have achieved product-market fit — and if not, to understand what is preventing it. It is most valuable at early stages, when you are still defining your product and your market. Once you have PMF, you may run it periodically after major changes, but it is not a continuous tracking tool.
NPS is a tracking tool. It measures loyalty over time and helps you identify whether overall user sentiment is improving or declining. It is most useful once you have a stable product and a growing user base. It tells you how users feel quarter over quarter, not whether you have found your market.
Run the PMF survey to find your market. Run NPS to monitor your relationship with it.
The qualitative output from both surveys feeds the same place: your feedback system. For more on how to build that system, see the guide on collecting customer feedback and the broader user feedback guide.
Try Quackback — open source with a managed cloud option. Start free. Get started | View on GitHub
Frequently asked questions
How many responses do I need to trust my PMF score?
Aim for at least 40-50 responses before drawing conclusions. At that level, a single answer shifts your score by roughly 2 percentage points. Reach 100 responses to segment by cohort reliably. With a small user base, extend the survey window rather than lowering the threshold.
Should I include churned users in the survey?
Filter churned users out of your PMF score by placing them in the "N/A" category. Their responses reflect a product they have already left — useful churn research, but not a measure of product-market fit. Run a separate churn survey to understand why they left.
What if my score is strong overall but weak in a specific segment?
A strong overall score with a weak segment means you have product-market fit in some parts of your market and not others. Identify the segment dragging the score down. If it is a strategic priority, treat its open-ended responses as a roadmap. If not, reconsider acquiring those users.
How is the PMF survey different from a customer satisfaction survey?
A satisfaction survey asks how users feel about their experience, measuring quality. A PMF survey asks how users would feel if the product were taken away, measuring dependency. A product can be pleasant but not essential — rated highly for satisfaction yet "not disappointed" on a PMF survey.
Authored by James Morton
Founder of Quackback. Building open-source feedback tools.
Try Quackback
The open-source feedback platform. Boards, voting, and roadmaps.
Get startedStar on GitHub132