
Most product teams agree that customer feedback should drive what they build. Far fewer have a process that actually makes it happen. The gap between intention and practice is where this report lives. The figures below are drawn entirely from published industry research, not from Quackback, and they tell a consistent story: feedback is the second-strongest influence on strategy, yet the systems for collecting and acting on it remain inconsistent, and most of what gets shipped goes unused.
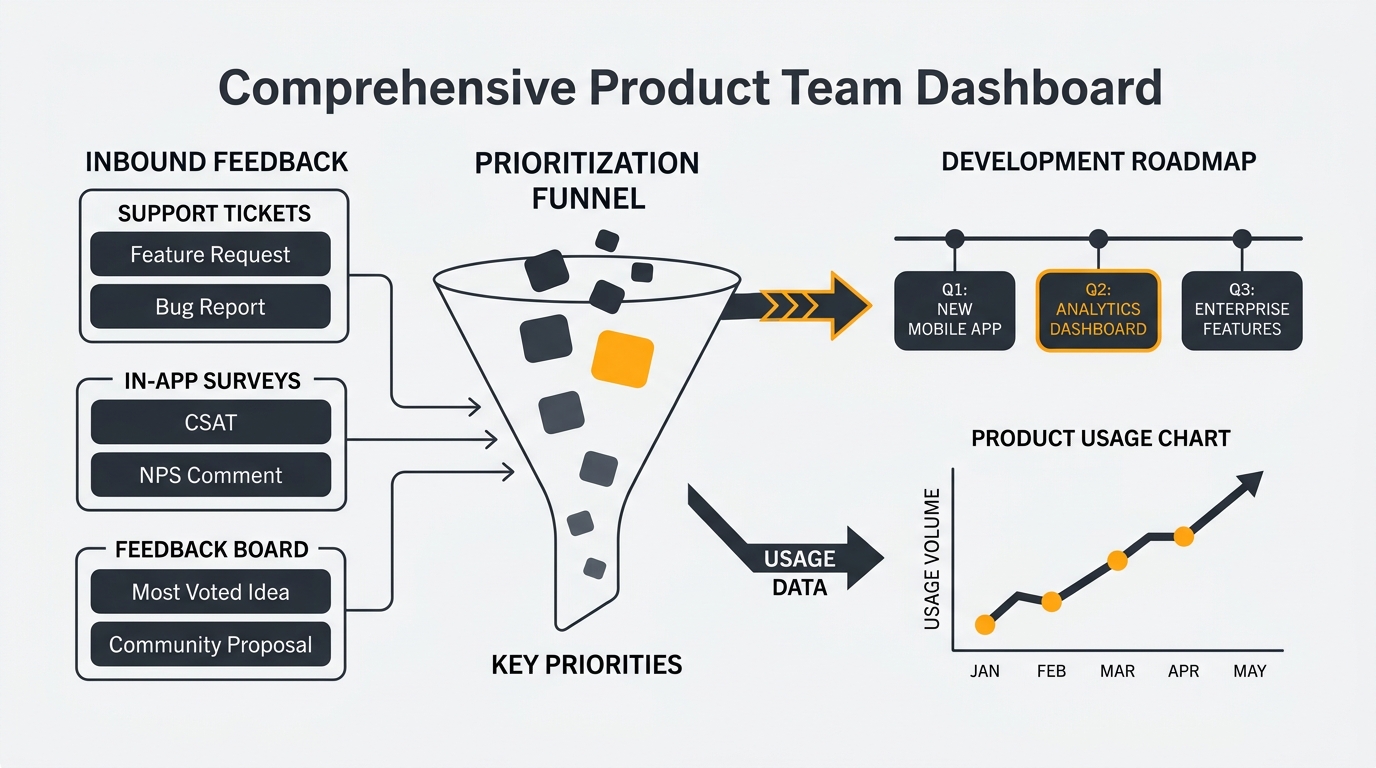
TLDR: Customer needs are the second-largest influence on product strategy (54.9%), just behind leadership direction, yet only 34% of teams run a continuous feedback process and 80% of shipped features are rarely or never used. AI is now near-universal in product work (100% of teams use it), making feedback the input most worth getting right.
Key findings
- Customer feedback is the second-largest influence on product strategy. 54.9% of product professionals cite customer needs and user insights, narrowly behind leadership direction at 57.8%.
- Only a third of teams collect feedback continuously. Just 34% regularly collect insights to guide prioritization; the rest work ad-hoc or have no consistent process.
- Most of what gets built goes unused. 80% of features in the average software product are rarely or never used, and for every 100 features launched, only 6.4 drive 80% of click volume.
- The customer-experience payoff is large and measured. Companies that excel at customer experience grow revenue 4% to 8% above their market.
- AI is now standard in product work. 100% of product teams use AI tools and 94% of professionals use AI daily or often.
- Customers do not trust the loop. Only 16% of customers strongly believe their feedback drives actual change.
- SaaS spend keeps climbing while seats go unused. SaaS spend averages $4,830 per employee, up 21.9% year over year, and companies use only 49% of provisioned licenses.
Collection and channels
Feedback weighs heavily on strategy, but the systems for gathering it are uneven. In the State of Product Management Report 2026, 54.9% of product professionals named customer needs and user insights as a top influence on product strategy. That is the second-largest force in the ranking, just behind leadership direction and internal priorities at 57.8%, and well ahead of sales or customer escalation requests at 30.7%. Customer voice matters more than the loudest internal request, but not more than the executive in the room.
The collection process does not match that importance. Only 34% of teams regularly collect insights and use them to guide prioritization. The rest are improvising: 19.3% rely mostly on ad-hoc customer requests or escalations, and 12.3% have no consistent research or feedback process at all. A continuous loop is still the minority practice. A persistent feedback board that captures input as it arrives, rather than during a quarterly scramble, is what separates the third that run a process from the two-thirds that do not.
Where you ask matters as much as whether you ask. Across 8,391 surveys from 1,087 companies, the median response rate was 29.05%, but the channel swung results by an order of magnitude: on-page contextual surveys hit 55.07% while widget surveys managed 7.64% and Intercom surveys 5.41%. In-app surveys perform well overall, averaging 27.52%, with mobile apps at 36.14% outperforming web apps at 26.48%. The in-app advantage is long-standing: companies see 2x to 10x higher response rates when they move NPS surveys in-app rather than to email.
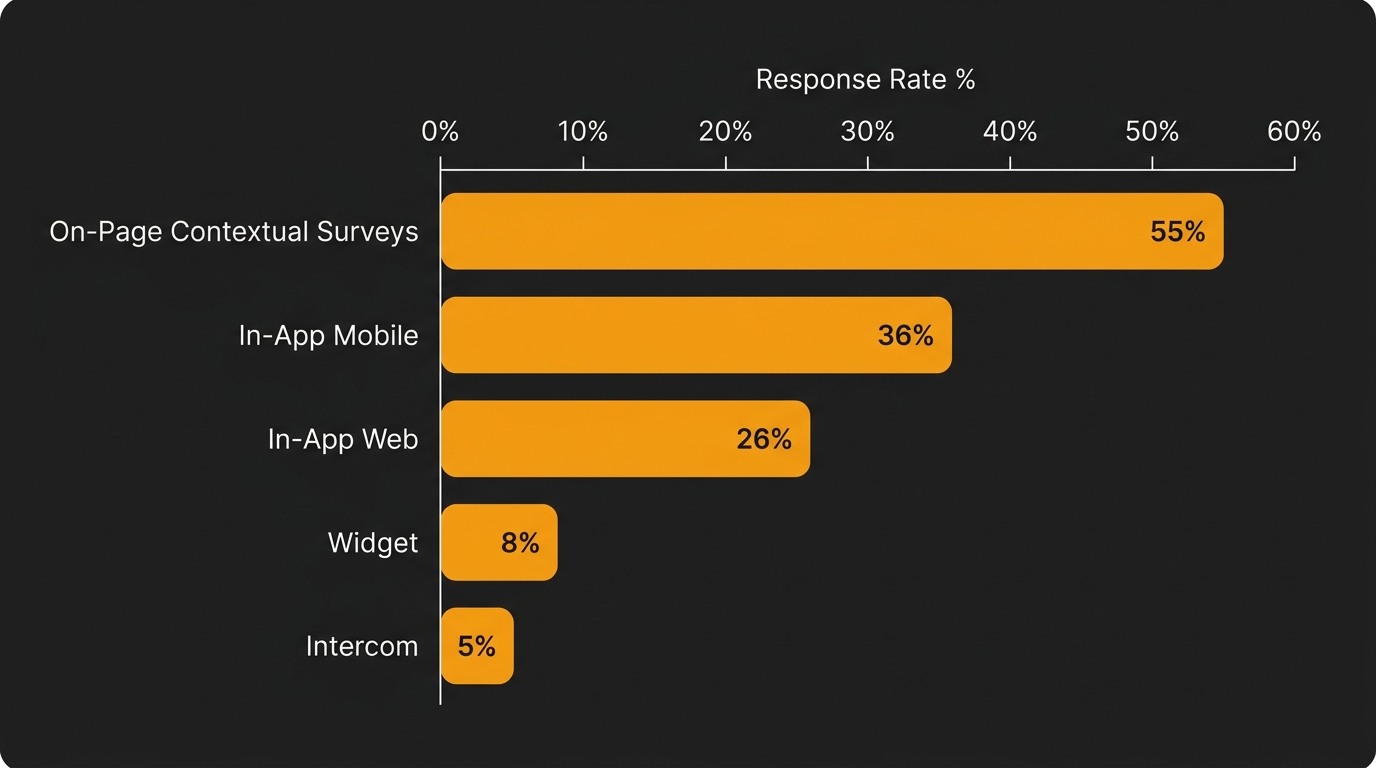
Two structural challenges shape collection. B2B teams get materially lower response rates than B2C, with a median of 21.88% for B2B versus 36.67% for B2C across the same dataset. And maturity compounds: in older Pendo research, 70% of advanced organizations solicited feedback more than monthly and 65% used NPS surveys, against just 14% NPS adoption among less-developed programs. The teams already collecting well tend to collect even more.
Prioritization and the backlog
Collecting feedback is the easy half. Deciding what to do with it is where most teams come undone. Only 13.5% of product professionals consistently use a formal scoring or prioritization framework such as RICE, MoSCoW, or Kano. The rest prioritize by instinct, negotiation, or whoever escalated last. And priorities do not hold once set: 60.2% of product managers cite leadership escalations or new directives as the primary reason priorities shift after they have been agreed.
The cost of ad-hoc prioritization shows up in adoption. 80% of features in the average software product are rarely or never used. The concentration is stark: for every 100 features built and launched, only 6.4 drive 80% of click volume, and even for best-in-class products, feature adoption reaches only 15.6%. This is not a new finding. A long-cited Standish Group benchmark from 2002 put it at 64% of features rarely or never used, though that figure came from only four internal applications and has largely been superseded by Pendo's broader data.
Teams sense the disconnect. 69% of teams say the products and features they release are not consistently well-received by customers, and 65% say their product initiatives regularly fail to meet deadlines. Building the wrong thing, late, is the default outcome when prioritization runs on escalation rather than evidence. A ranked, transparent voting board gives demand a number, which is harder to override than a hunch. For the full method, see customer feedback analysis and feedback management.
Business impact
The case for acting on feedback is not soft. Companies that excel at customer experience grow revenue 4% to 8% above their market. McKinsey found that experience-led growth strategies which raise customer satisfaction by at least 20% lift cross-sell rates 15% to 25%, share of wallet 5% to 10%, and customer satisfaction and engagement 20% to 30%.
The retention math is even sharper. Acquiring a new customer is five to 25 times more expensive than retaining an existing one, and increasing retention by 5% increases profits by 25% to 95%, per Frederick Reichheld of Bain. Keeping the customers you have is the cheapest growth available, and listening to them is how you keep them.
The downside is measured in trillions. Qualtrics estimates $3.8 trillion of global sales is at risk in 2025 from bad customer experiences, because 53% of consumers say they will cut spending after a poor one. The growth gap between leaders and laggards is visible in the market: Forrester found CX leader AT&T U-Verse grew at a 35% CAGR from 2010 to 2014 versus Comcast's 6%, and Amazon's four-year US revenue CAGR ran 16 times Wal-Mart's, 31% to 2%.
Metrics and benchmarks
Satisfaction metrics give teams a shared yardstick, but the right band depends on industry. In Qualtrics' 2024 consumer benchmark of 354 companies across 22 industries, grocery stores earned the highest average NPS at 34.3 while car rental companies earned the lowest at 15.8. The same pattern holds on overall experience ratings, where grocery scored 71% and car rental 52%. For CSAT specifically, industry guidance puts a good score in the 70% to 85% range. For the full breakdown, see customer satisfaction metrics.
The benchmarks are moving in the wrong direction. Forrester's 2024 US Customer Experience Index found CX quality at an all-time low after a third straight year of decline, with 39% of brands significantly declining versus 17% in 2023, and only 3% of companies qualifying as customer-obsessed. The earlier reading was no better: 51% of consumers reduced or stopped spending after a poor experience, putting roughly $3.7 trillion in 2024 sales at risk.
The dominant metric itself is contested. NPS is deeply embedded: at least two-thirds of the Fortune 1000 use it, and 58% of customer service leaders were required by leadership to measure it. Yet Gartner predicted more than 75% of organizations would abandon NPS as a customer-service success measure by 2025. The reason traces back to foundational research: a study of more than 75,000 customers found 96% of high-effort service interactions produced disloyalty versus only 9% of low-effort ones, suggesting effort, not enthusiasm, is what to measure. For more, see customer effort score.
AI in feedback
AI has moved from experiment to default in a single cycle. In Productboard's 2025 research, 100% of product teams reported using AI tools and 96% use it consistently. At the individual level, 94% of product professionals use AI daily or often. It is reshaping org charts, not just workflows: 98% of teams have changed or plan to change team structures because of AI, while reporting roughly four hours saved per task and about 33 hours across core functions.
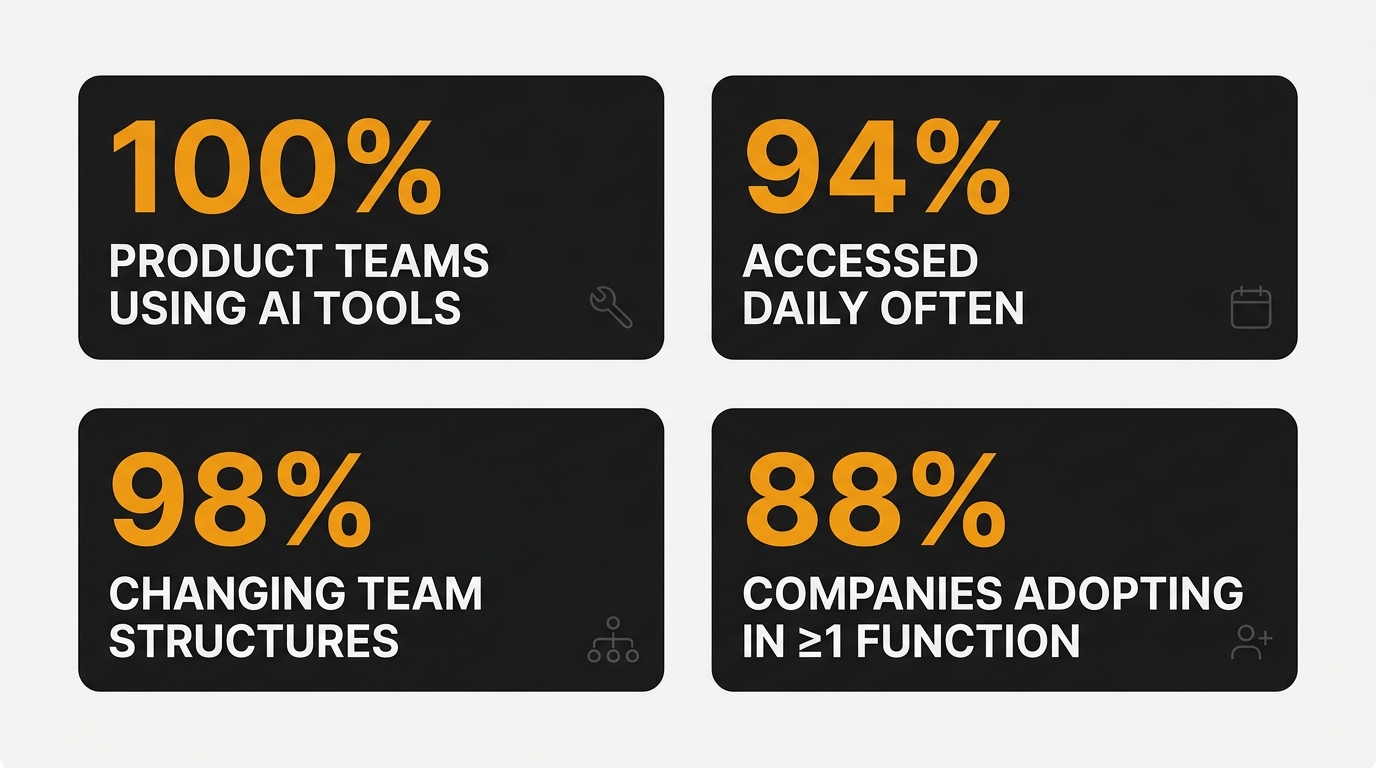
The stickiness is real. Across a 1,750-person survey, 83.6% named at least one AI tool they would be very disappointed to lose, and 63% of product managers say AI saves them four or more hours a week. The organizational base keeps widening too: 88% of organizations now report regular AI use in at least one business function, up from 78% a year earlier, with generative AI use at 79%.
The next wave is agentic. Gartner predicts 40% of enterprise apps will feature task-specific AI agents by 2026, up from less than 5% in 2025, and that agentic AI will autonomously resolve 80% of common customer service issues by 2029, cutting operational costs 30%. That matters for feedback because 85% of customer service leaders will explore or pilot customer-facing conversational generative AI in 2025, and that channel is where much product feedback originates. An MCP server lets those agents read and triage your feedback directly, and AI duplicate detection and summaries collapse a thousand raw items into a handful of decisions. For the practical side, see AI customer feedback analysis and connecting a feedback tool to AI via MCP.
Closing the loop and roadmaps
Collecting and prioritizing feedback is wasted if customers never see it return. Most do not. Only 16% of customers strongly believe their feedback drives actual change, a trust gap that public roadmaps and visible loop-closing exist to fix. When the loop stays open, customers leave: 80% of customers say they have switched brands because of a poor experience, and 49% of customers who left a brand they had been loyal to cite poor experience as the reason.
Closing it pays. In CustomerGauge's vendor research, closing the loop at every level reduced churn by at least 2.3% per year while failing to close it raised churn by at least 2.1%. Speed compounds the effect: closing the loop within 48 hours increased retention by 12% and lifted NPS by an average of six points, and businesses that closed the loop after an NPS survey had 3x the promoters in their next cycle. Customers also reward the gesture itself: 77% of consumers view brands more favorably when those brands proactively invite and act on feedback.
The alternative is expensive building. Pendo found 80% of features in the average product are rarely or never used, and that publicly-traded cloud companies collectively invested up to $29.5 billion building features that may never be touched. A public roadmap and a regular changelog turn that one-way spend into a two-way loop: customers see what is coming, vote on it, and watch it ship. For the discipline behind it, see the customer feedback loop.
Tooling and spend
The money flowing into software keeps the stakes high. Gartner forecasts worldwide public-cloud end-user spending at $723.4 billion in 2025, up 21.5% year over year, with SaaS the largest single segment at roughly $300 billion in 2025, up from about $250 billion in 2024.
Much of that spend is wasted. Organizations waste an average of $21 million annually on unused SaaS licenses, a 14.2% year-over-year increase, and use only 49% of provisioned licenses. Per-head cost is rising fast: SaaS spend now averages $4,830 per employee, up 21.9% year over year, across an average portfolio of 342 applications.
This is where per-seat pricing on feedback tools quietly hurts. When half your provisioned seats sit idle, paying per seat for a feedback platform taxes the exact people you want contributing. Cost pressure is also pushing teams toward open source: 95% of organizations increased or maintained their open-source usage, 33% increased it significantly, and cost reduction was the top reason cited. Quackback fits that pattern: it is open source, self-hosted, and free, with no feature gates tied to pricing tiers. AI is built in. See the pricing page and the docs to deploy.
Methodology and sources
This report is compiled entirely from published industry research. None of the figures come from Quackback's own data. Each source is linked inline near its data; where one source supports several nearby figures, only the first carries the link, to keep the report readable. The full source list appears below. Figures are reported as the source published them, with corrections applied where a source's framing or sample size differed from how a figure is commonly repeated. Survey-based figures carry the sample sizes and years their publishers stated; some benchmarks are older and are flagged as such in context. Vendor research, where used, is identified as vendor research rather than independent study.
Sources cited in this report:
- Product-Led Alliance and ProductPlan, State of Product Management Report 2026 (Q4 2025 survey, ~250 product professionals)
- Survicate, Survey Response Rate Benchmarks 2025
- Refiner, In-App Survey Response Rates Benchmark Report 2025
- Pendo, In-App NPS Surveys (2017), Combining Product Data with In-App Feedback (2016), The 2019 Feature Adoption Report, and 2024 Software Benchmarks with Mind the Product
- Productboard, 2021 Product Excellence Report, 2024 State of Product Excellence Report, and The New Reality of AI in Product Management (2025, with UserEvidence)
- Mountain Goat Software citing Standish Group / Jim Johnson (XP 2002)
- Bain & Company, The Five Disciplines of Customer Experience Leaders (2015)
- McKinsey & Company, Experience-led growth (2023) and The State of AI in 2025
- Harvard Business Review, The Value of Keeping the Right Customers (2014) and Stop Trying to Delight Your Customers (2010)
- Qualtrics XM Institute, sales-at-risk reports (2024, 2025) and 2024 XMI Customer Ratings; Qualtrics and ServiceNow customer service research (2021)
- Forrester, CX Leaders Crush Laggards on Revenue Growth (2015) and 2024 US Customer Experience Index
- Gartner, NPS prediction (2021), conversational GenAI survey (2024), task-specific agents and agentic AI predictions (2025), public-cloud spending forecast (2024), and feedback-trust figure via Customer Experience Dive (2025)
- Fortune, Net Promoter Score reporting (2020)
- SurveyMonkey, What Is a Good CSAT Score?
- Lenny's Newsletter (Rachitsky and Segal), AI productivity survey (2025, n=1,750)
- CustomerGauge, Closed Loop Feedback research (vendor data)
- Zendesk CX Trends Report 2023 (citing Emplifi)
- Microsoft, 2018 State of Global Customer Service Report
- Zylo, 2024 and 2025 SaaS Management Index
- OpenLogic by Perforce, 2024 State of Open Source Report
- Productiv, 2024 SaaS statistics
Frequently asked questions
How many product teams collect feedback continuously?
Only 34% of product teams regularly collect insights and use them to guide prioritization, per the State of Product Management Report 2026. The rest work ad-hoc or have no consistent feedback process, despite customer needs ranking as the second-largest influence on product strategy.
What percentage of software features actually get used?
80% of features in the average software product are rarely or never used, according to Pendo's 2019 Feature Adoption Report. For every 100 features launched, only 6.4 drive 80% of click volume, and even best-in-class products see just 15.6% adoption.
How much does customer experience affect revenue?
Companies that excel at customer experience grow revenue 4% to 8% above their market, per Bain. Increasing retention by 5% raises profits 25% to 95%, while bad experiences put an estimated $3.8 trillion in global sales at risk in 2025.
How widely do product teams use AI in 2026?
AI use is near-universal. 100% of product teams use AI tools and 94% of professionals use it daily or often, per Productboard's 2025 research. Gartner predicts 40% of enterprise apps will feature task-specific AI agents by 2026.
Does closing the feedback loop reduce churn?
Yes. Closing the loop at every level reduced churn by at least 2.3% per year in CustomerGauge's vendor research, and doing it within 48 hours raised retention 12%. Yet only 16% of customers strongly believe their feedback drives actual change.

Authored by James Morton
Founder of Quackback. Building open-source feedback tools.
Try Quackback
The open-source feedback platform. Boards, voting, and roadmaps.
Get startedStar on GitHub305