Most articles about customer feedback analysis start with a definition and end with a screenshot of a $50,000 platform. You are left with a vocabulary lesson and a sales pitch, and no honest answer to the only question that matters: what is the minimum-effort method that will help you decide what to build next?
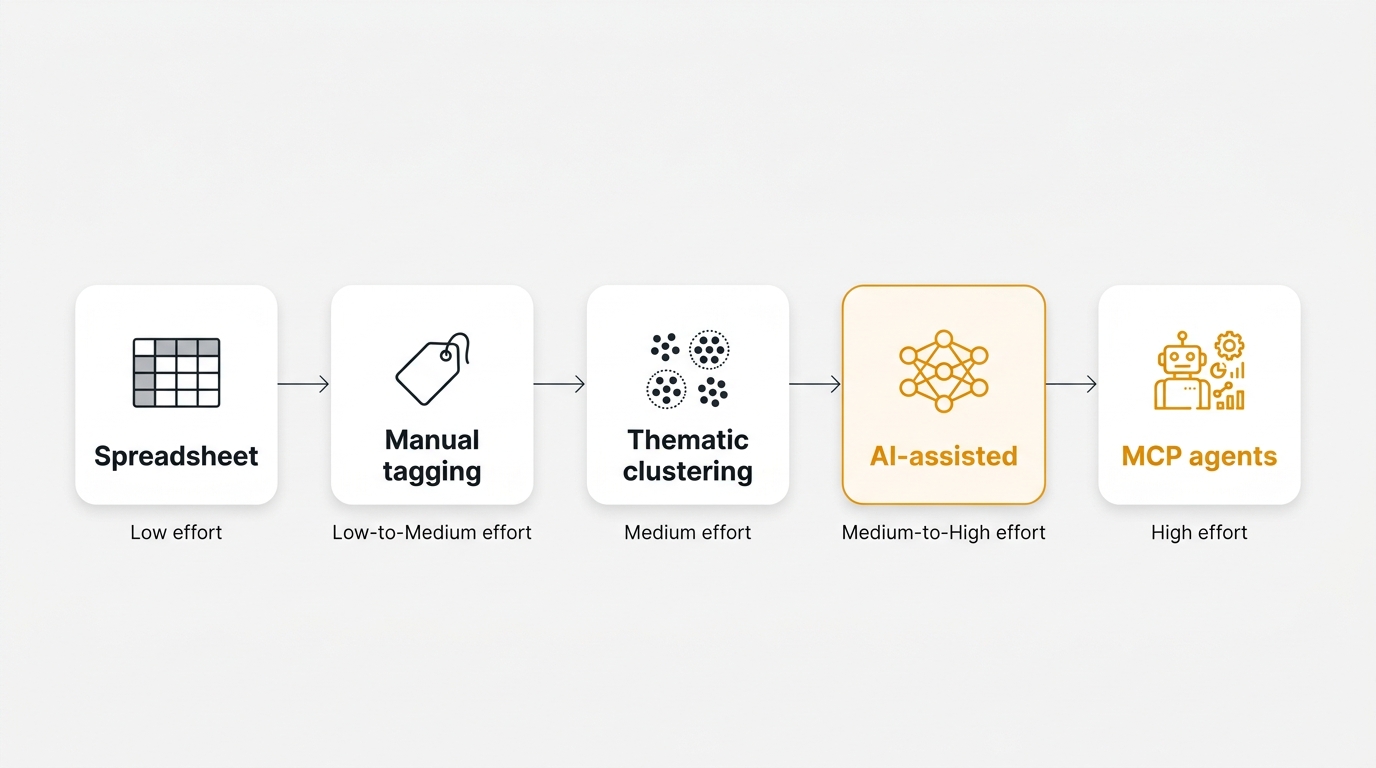
Customer feedback analysis is the process of sorting raw feedback into categories, themes, and decisions so you can choose what to build next. The five methods, ranked by effort versus insight, are: spreadsheet and pivot tables, manual tagging with a fixed taxonomy, thematic clustering, AI-assisted analysis, and integrated platforms with MCP agents. Pick the lowest-effort method that answers your actual question, and graduate only when that method breaks.
Why most feedback analysis advice is useless
Search "customer feedback analysis" and you find a pattern. Post one defines the term. Post two lists five benefits. Post three pastes a nine-step framework that ends with "and then use our platform to do it for you." None tell you where to start if you have 30 feedback items and one afternoon to figure out what is going on.
Analysis is a function of volume. At 30 items a week, you do not need a platform. You need a sorting shelf. At 3,000 items a week, a sorting shelf will bury you. The right method depends on how much feedback you have, how much time you can spend reading it, and what decision the output needs to support.
This post walks up the ladder. Five methods, ordered by effort. Each one is honest about where it works and where it breaks. You pick the lowest rung that answers your question, and you only graduate when you have to. For the wider discipline, see the user feedback guide. For the qualitative-versus-quantitative split, see qualitative vs quantitative feedback. If you are still sourcing the raw input, start with collect customer feedback.
Method 1: Spreadsheet and pivot tables (honest baseline)
A spreadsheet is not a joke. It is the method every team uses at the start, and most teams never admit it in public.
Export your raw feedback to CSV — survey responses, support tickets, sales call notes, or replies to a product update. Paste it into one tab. Add three columns: category, severity, and decision. Category is a short taxonomy you decide up front — six to eight labels, no more. Severity is high, medium, or low. Decision is one of: build, watch, decline.
Read each row. Fill in the three columns. This takes about ten seconds per item once you have your categories. Then build a pivot table: rows are category, columns are decision, values are count. You now have a two-dimensional map of what is coming in and what you intend to do with it.
That map is enough to answer questions like "which category dominates this week" and "are we declining more than we build." It is not enough to surface duplicates, track trends over months, or detect themes you did not anticipate. It is also brittle: once you pass roughly 200 items, the sheet becomes a chore to maintain and people start tagging less carefully to save time.
A clean spreadsheet beats a messy platform. For a concrete template, see feature request tracking spreadsheet. For the upgrade path, see feature request tracking.
When spreadsheets work: under 200 items a month, one person doing the analysis, a small number of recurring categories.
When they break: more than one person tagging, tag drift, volume above 200 items a month, or a need to track the same theme across weeks.
Method 2: Manual tagging with a fixed taxonomy
Manual tagging is the grown-up cousin of the spreadsheet method. The difference is not the tool. It is the discipline. Everyone tags with the same vocabulary, and the vocabulary does not change without review.
The key move is the fixed taxonomy. Decide your tags once. Write them down with one-sentence definitions. Do not let people invent new tags in the moment. If a piece of feedback does not fit, flag it for a weekly review where you decide whether to add a tag or widen an existing one.
The rule that will save you the most pain: no taxonomy should exceed ten top-level tags. If you have twenty, nobody can remember them, and tagging becomes a guessing game. Ten is the upper bound where a tagger can hold the full list in their head. Subdivide with sub-tags if you need more granularity, but the top level stays small.
Avoid freeform tagging. A freeform field produces "bug", "Bug", "bugs", "defect", "broken", and "crash" as six different categories. That is noise masquerading as data. If your tool supports a fixed dropdown, use it. Quackback's feedback management supports exactly this: fixed categories, structured status, and a consistent tag vocabulary across the inbox.
Manual tagging scales to around 500 items a month per tagger. Above that, the tagger cuts corners and quality degrades silently. For the broader operational picture, see feedback management.
When manual tagging works: a PM or support lead with up to a few hundred items a month, a stable product area, a taxonomy that does not need to evolve weekly.
When it breaks: multiple taggers without weekly calibration, fast-moving product areas, or volume above 500 items a month.
Method 3: Thematic clustering (when volume breaks tagging)
Thematic clustering is what you do when you have too much feedback to pre-classify but still need to find the patterns. Instead of deciding categories in advance and forcing every item into one, you read a sample, extract the themes that emerge, and then tag the rest against those themes.
The practical workflow. Take a random sample of fifty items. Read them slowly. Note any phrase or topic that repeats. By the end, you will have eight to fifteen candidate themes. Some will be obvious. Some will surprise you. The surprises are the point. Group those themes into a shorter working list of six to ten clusters, and tag the remaining items against that list. This is different from Method 2 because the taxonomy came from the data, not from your assumptions.
The word you will hear for the automated version is embedding. An embedding is a compact numerical summary of a piece of text, arranged so that similar texts end up close to each other. Clustering software uses those summaries to group items automatically. You do not need to understand the math. You do need to know that any machine clustering should be reviewed by a human before it drives a decision — machines happily group things that share vocabulary without sharing meaning.
Thematic clustering is the minimum viable method above roughly 500 items a month. Below that, a fixed taxonomy is faster. Above it, you cannot keep a taxonomy stable enough to be useful. For a deeper take on the qualitative technique, see voice of customer.
When clustering works: volume between 500 and 2,000 items a month, a product area that is still evolving, a team willing to review the cluster labels before acting on them.
When it breaks: if you let the clusters run without human review. Unsupervised clustering will confidently group "bug in the billing page" with "I would like to be billed annually" because both mention billing. You still need a human to keep the grouping honest.
Method 4: AI-assisted analysis (sentiment and topic)
This is where automation starts doing real work. An AI-assisted workflow can do four things well: deduplicate similar submissions, score sentiment, suggest tags from your existing taxonomy, and summarise long-form responses. These are first-pass operations. They do not replace your judgment. They make your judgment cheaper to apply.
Duplicate detection is the highest-leverage AI task for most teams. If a feature request has been submitted seventeen times in slightly different words, a human skimming the inbox will see five or six and call it a trend. A language model can match all seventeen and give you a real count. That changes priorities.
Sentiment scoring is more mixed. On clearly-worded feedback, it is accurate enough to filter. On sarcasm, mixed intent ("love the new feature, but it crashes"), and deadpan complaints, sentiment gets fooled. Treat it as a hint, not a verdict. Topic assignment sits in the middle: useful as a first pass, unreliable on edge cases.
AI is one method on the ladder, not the whole ladder. It shines at volume and struggles with nuance. For a deeper walkthrough of exactly what AI can and cannot do, including prompt patterns and failure modes, read ai customer feedback analysis. That post is the AI deep-dive. This section places AI at its correct rung. For the adjacent case of survey-specific analysis, see ai survey analysis.
Quackback runs AI as an optional layer over structured data. The inbox stores clean rows with fixed fields. AI triages, groups, and summarises on top of that. For how this compares to other tools, see best customer feedback tools 2026.
When AI-assisted analysis works: volume above 1,000 items a month, a clear taxonomy it can suggest against, and humans still reviewing the output before decisions get made.
When it breaks: treating the output as authoritative, running it on ambiguous or sarcastic text without review, or using it to replace the step where a human actually reads the top themes.
Method 5: Integrated feedback platform with MCP and AI agents
The top of the ladder is not just "AI analysis inside your feedback tool." It is the point where analysis stops being a periodic activity and becomes a continuous background process. The mechanism is a standard called MCP — the Model Context Protocol — which lets an AI agent connect to a feedback system and act on it through a defined set of tools.
The difference in practice. With Method 4, you run an analysis. A report comes out. You read it. You make decisions. A week later you run it again. With Method 5, an agent watches the inbox, matches new items against existing threads, merges duplicates, flags urgent items, and updates status. You review the agent's decisions once a day. The analysis never stops.
This is not theoretical. An MCP-compatible feedback system exposes tools like search_posts, merge_duplicates, update_status, and add_comment. An agent with those tools can maintain a clean backlog continuously, rather than waiting for a weekly triage session that never quite happens. For the protocol, see what is an mcp server. For hooking a feedback tool to a model, see connect feedback tool to ai via mcp. For the feedback-management case specifically, see mcp server feedback management.
The unit of analysis stops being "last month's feedback" and becomes "the current state of the inbox." The question changes from "what themes showed up this month" to "what is the system's best current picture of the top unresolved themes." That is a qualitative jump, and it removes the bottleneck every other method has: a human sitting down to read.
Quackback has a built-in MCP server that exposes the inbox, posts, comments, and status to a language model, so an agent can do the continuous triage work. It is open source, self-hosted, and free, so "graduating" to Method 5 is not a procurement exercise.
When MCP agents work: high volume, a stable taxonomy the agent can learn against, a team that wants the human in the review seat, not the data-entry seat.
When they break: no human review at all. An agent left alone will cheerfully merge the wrong tickets and close the wrong threads. The point is to move the human from "reading every item" to "reviewing the agent's decisions."
How to choose: volume, team size, decision stakes
The opinionated version. Pick the lowest rung that answers your question. Graduate only when the method breaks.
| Your situation | Recommended method |
|---|---|
| Pre-PMF, 20 to 50 items a month | Method 1: spreadsheet |
| PM-of-one, 50 to 200 items a month | Method 2: fixed taxonomy tagging |
| Product team, 500 to 1,500 items a month | Method 3: thematic clustering |
| At scale, 1,500 to 5,000 items a month | Method 4: AI-assisted analysis |
| Continuous triage without a human bottleneck | Method 5: MCP agents |
Three rules for reading this table. Volume is the blunt cut, but decision stakes matter more — if you are deciding what to build for an enterprise customer, do not trust a machine cluster. Team size changes everything: one tagger can be consistent with a spreadsheet, three cannot. And the cost of a wrong answer sets the floor. High-cost decisions need human eyes on the final shortlist no matter what method produced it.
If you are weighing tools rather than methods, the feedback analysis use case page helps. For why analysis matters inside a product loop, see customer feedback loop.
Common mistakes that invalidate any method
Four mistakes will invalidate your analysis regardless of the method. Any method done with these mistakes is worse than no method, because it produces a confident answer that is wrong.
Sampling bias — only looking at loud feedback. The squeakiest wheel is the first thing you hear, but it is almost never the most important thing. Teams that only read support tickets miss the silent majority who never write in. Teams that only read Twitter miss everyone who is not on Twitter. Fix this by sampling from multiple channels, including low-effort ones like quick in-app widgets, before you start tagging.
Over-tagging — fifty tags, none useful. Tag sprawl is the single most common failure. You start with seven categories. A month later you have twenty. Three months later you have forty-eight. Nobody can remember them, tagging becomes inconsistent, and your pivot tables turn into confetti. The fix is to review your taxonomy every month and merge anything under five percent of volume into a larger bucket.
Skipping the "what decision does this drive" question. Before you tag a single item, write down the decision you want the analysis to support. "What should we build next quarter" is a decision. "Which category is biggest this month" is a report. Reports are not decisions. If you cannot name the decision, you are doing analysis theater, and you will finish with a pretty chart and no outcome.
Forgetting to close the loop. You read the feedback, you run the analysis, you ship something, and you never tell the users who asked for it. This is the mistake that quietly destroys your feedback source. People learn that writing in does not matter, and they stop. Next quarter, your volume drops, and you mistake it for "fewer complaints" when it is really "fewer speakers." The fix is operational: every shipped item should trigger a reply to the users who requested it. Quackback's feedback workflow does this automatically, but the point is broader than the tool — close the loop on every method. The deeper mechanics of this are in customer feedback loop.
The right customer feedback analysis method fits your current volume and team, not the screenshots on a landing page. Start at the bottom of the ladder. A disciplined spreadsheet with seven categories beats a neglected platform with twelve dashboards. When the spreadsheet breaks, graduate. When the fixed taxonomy breaks, graduate again. When human reading stops scaling, bring in AI. When periodic analysis stops scaling, bring in agents. For setup across each layer, see the Quackback docs.
Try Quackback — open source with a managed cloud option. Start free. Get started | View on GitHub
Frequently asked questions
What is the best way to analyze customer feedback?
The best method is the lowest-effort one that answers your actual question. For most teams under 200 items a month, that is a disciplined spreadsheet with six to eight fixed categories and a weekly pivot. Above that, a fixed taxonomy in a structured inbox. Above roughly 1,000 items a month, AI-assisted triage with human review. There is no single best method — there is a best method for your current volume and decision stakes.
Can AI replace manual customer feedback analysis?
No, not completely. AI is good at first-pass work — deduplication, sentiment scoring, topic suggestions, and summarisation. It is unreliable on sarcasm, mixed intent, and edge cases. Use AI to narrow two thousand items down to the top twenty themes, then read those twenty yourself before making decisions. Treat AI as a filter, not a verdict.
How many tags should a feedback taxonomy have?
No more than ten top-level tags. That is the upper bound where a human tagger can hold the full list in their head and tag consistently. If you need more granularity, use sub-tags under a stable top level. Review the taxonomy monthly and merge any tag under five percent of volume into a larger bucket.
When does a spreadsheet stop being enough for feedback analysis?
Around 200 items a month, or as soon as more than one person is tagging, whichever comes first. The failure mode is tag drift — two people use slightly different words, and your pivots start lying. A fixed-taxonomy tool with dropdowns is the next step. See feedback management for the operational details.
What is thematic analysis of customer feedback?
Thematic analysis is the practice of reading a sample of feedback, extracting the themes that repeat, and then grouping the rest against those themes. It differs from manual tagging because the categories emerge from the data rather than being defined in advance. It is the minimum viable method above about 500 items a month, and it is what AI clustering automates at higher volumes.
Do you need a feedback platform to analyze customer feedback?
No. You can get real value from a spreadsheet for a long time. You need a platform when one or more of these breaks: volume above 200 items a month, more than one person tagging, or a need to track themes across multiple weeks without losing context. At that point, a structured inbox like Quackback pays for itself by removing tag drift and enabling consistent reporting.
Authored by James Morton
Founder of Quackback. Building open-source feedback tools.
Try Quackback
The open-source feedback platform. Boards, voting, and roadmaps.
Get startedStar on GitHub132